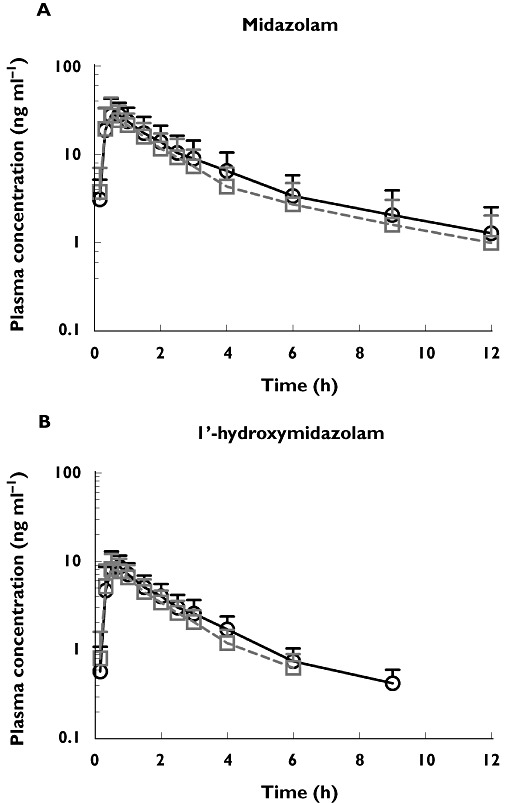
Figure 7.

The mean plasma concentration−time profiles of midazolam (A) and its metabolite 1′-hydroxymidazolam (B) after oral administration of 5 mg midazolam alone and after co-administration with AZD7325 (10 mg) to steady-state in healthy male volunteers (n = 23). Error bars represent SD. Midazolam alone (○), midazolam in the presence of AZD7325 (□)
