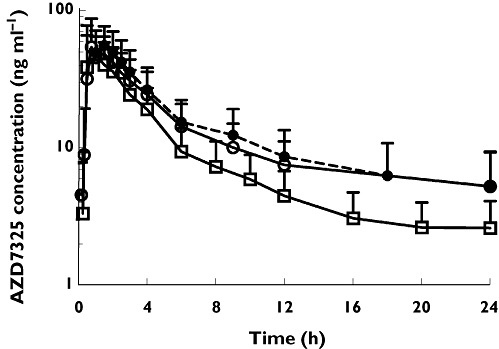
Figure 9.

The mean plasma concentration−time profiles of AZD7325 on day 1 ( ), day 11 (
 ) and day12 (
 ) after an oral daily dose of 10 mg AZD7325 in healthy male volunteers (n = 23). Error bars represent SD

The mean plasma concentration−time profiles of AZD7325 on day 1 ( ), day 11 (
 ) and day12 (
 ) after an oral daily dose of 10 mg AZD7325 in healthy male volunteers (n = 23). Error bars represent SD