Figure 1.

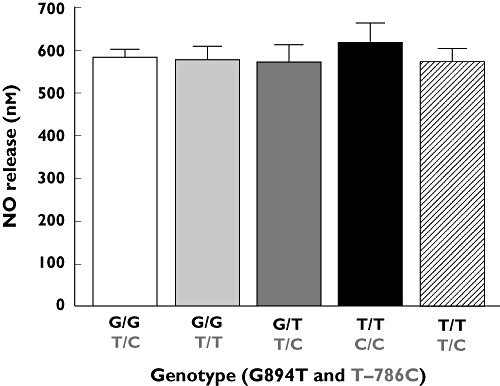
Release of NO from a single HUVEC cell with eNOS gene polymorphisms at positions 894 (G894T) and/or −786 (T–786C). Values are mean ± SD (n = 4–5 measurements of NO per donor, 3–6 donors per group)

Release of NO from a single HUVEC cell with eNOS gene polymorphisms at positions 894 (G894T) and/or −786 (T–786C). Values are mean ± SD (n = 4–5 measurements of NO per donor, 3–6 donors per group)