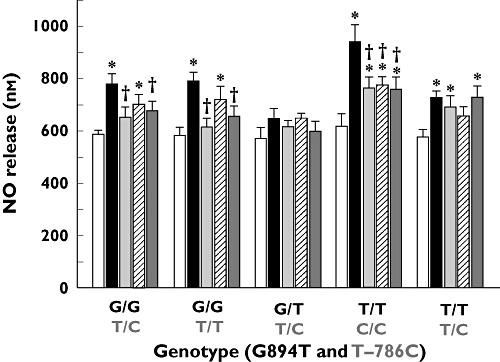
Figure 3.

Effect of ARB treatment (1 µm, 6 h treatment) on NO release from HUVECs obtained with eNOS gene polymorphisms at positions 894 (G894T) and/or −786 (T–786C). Values are mean ± SD (n = 4–5 measurements of NO per donor, 3–6 donors per group). *P < 0.05 vs. cognate control; †P < 0.01 vs. cognate olmesartan treatment (Student–Newman–Keuls multiple comparisons test; overall anova: P < 0.0001, F = 18.109). Control ( ); Tel (
 ); Val (
 ); Olm (
 ); Los (
 )
)
