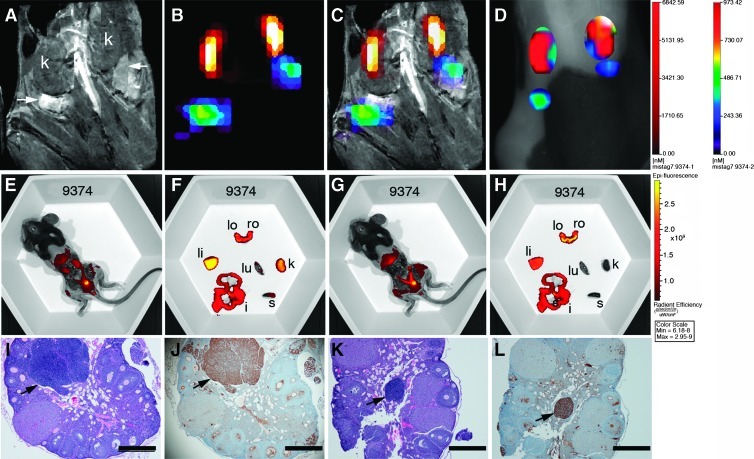
Figure 2.
Detection of cathepsin activity in TgMISIIR-TAg mouse with small ovarian tumors. (A) MR image showing essentially normal-sized ovaries (arrows) posterior to the kidneys (k). All MR and fluorescent images in this and in subsequent figures are shown from the dorsal perspective, where the left side of the mouse is on the left side of the image. (B) Fused FMT-MR image showing AnnexinVivo 750 detection of kidneys (yellow-orange and ProSense 680 detection of ovarian tumors (green/blue). (C) Overlay of FMT signals on the MR image. (D) TrueQuant image of the same mouse showing ROIs corresponding to kidney (red) and ovarian tumors (green/blue). Mice were imaged ex vivo (E–H) using the IVIS imaging system. Images in E and F were taken with 710-nm excitation and 760-nm emission filters, and those in G and H were taken with 640-nm excitation and 700-nm emission filters. After euthanasia, mice were partially dissected to expose the intact reproductive tract and kidneys (E and G). The reproductive tracts, left ovary (lo), right ovary (ro), and other organs, including liver (li), lung (lu), intestines (i), spleen (s), and kidney (k), were removed and imaged ex vivo using the 710/760 and 640/700 filter pairs (F and H, respectively). H&E- (I and K) and TAg- (J and L) stained sections show the presence of microscopic ovarian tumors (arrows) that exhibit strong nuclear TAg staining. Scale bars in H&E- and TAg-stained sections correspond to 500 µm.

