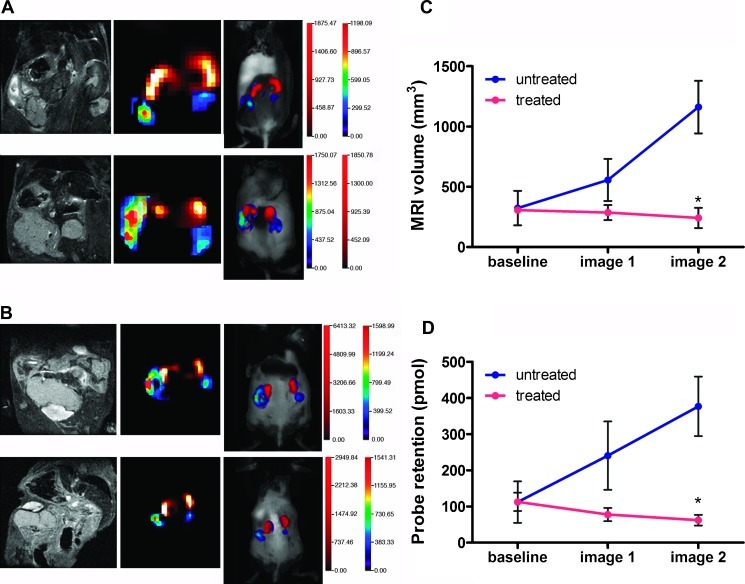
Figure 6.
Serial FMT imaging detecting tumor progression and response to chemotherapy. Mice (n = 8) were injected with IntegriSense 680 and received baseline FMT and MRI scans 24 hours later. Immediately after the baseline scan, mice were either injected with vehicle (n = 4) or were treated with combination chemotherapy (n = 4) and subsequently imaged twice at 12-day intervals (image 1 = day 12, image 2 = day 24). Representative images are shown for untreated (A) and chemotherapy-treated (B) mice, with baseline images on top and the second serial image at the bottom. A strong correlation was observed between tumor volume by MRI (C) and probe retention (D). Mean values ± SEM of the treated (red lines) and untreated (blue lines) mice are shown, and the mean differences in tumor size and probe retention in treated and untreated mice were significant (P < .001).

