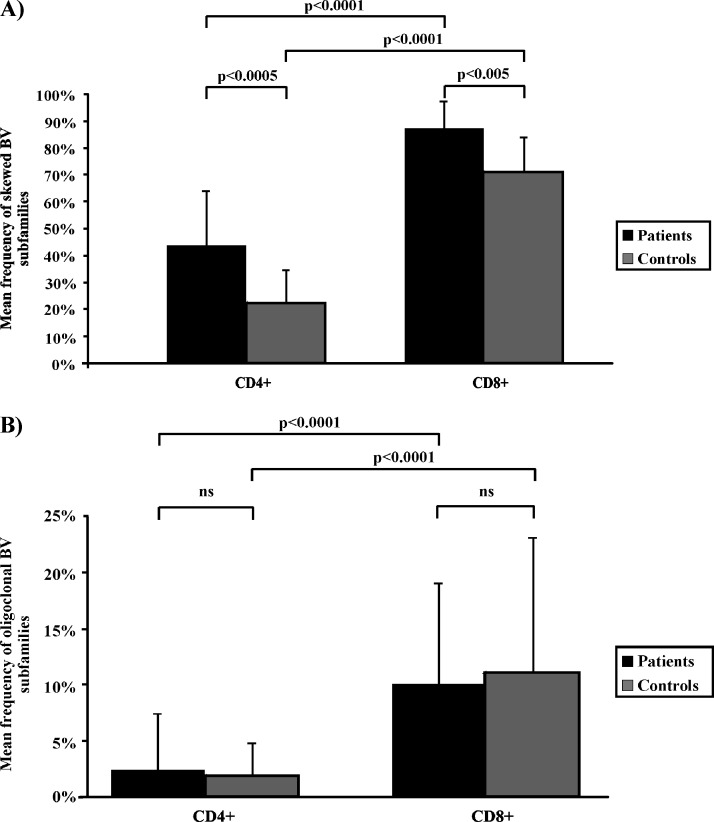
Figure 4.
Representation of the mean frequency of CDR3 spectratyping profiles in the BV subfamilies observed in patients with CKS and controls. (A) Patients were characterized by a significantly higher frequency of BV subfamilies showing a skewed profile in both CD4+ T cells (43% vs 25%, P < .0005) and in the CD8+ subset (86% vs 75%, P < .005). As expected, the occurrence of skewed BV subfamilies was significantly more frequent in CD8+ than in CD4+ cells in both controls and patients (P < .0001). (B) We found a similar incidence of BVs with an oligoclonal CDR3 spectratyping profile between patients and controls in both T-cell subpopulations (2.0% vs 1.8% in CD4+ T cells and 10.4% vs 11.3% in CD8+ ones). Once again, the frequency of oligoclonal BV subfamilies was significantly higher in CD8+ than in CD4+ cells in both controls and patients (P < .0001). NS indicates not significant.

