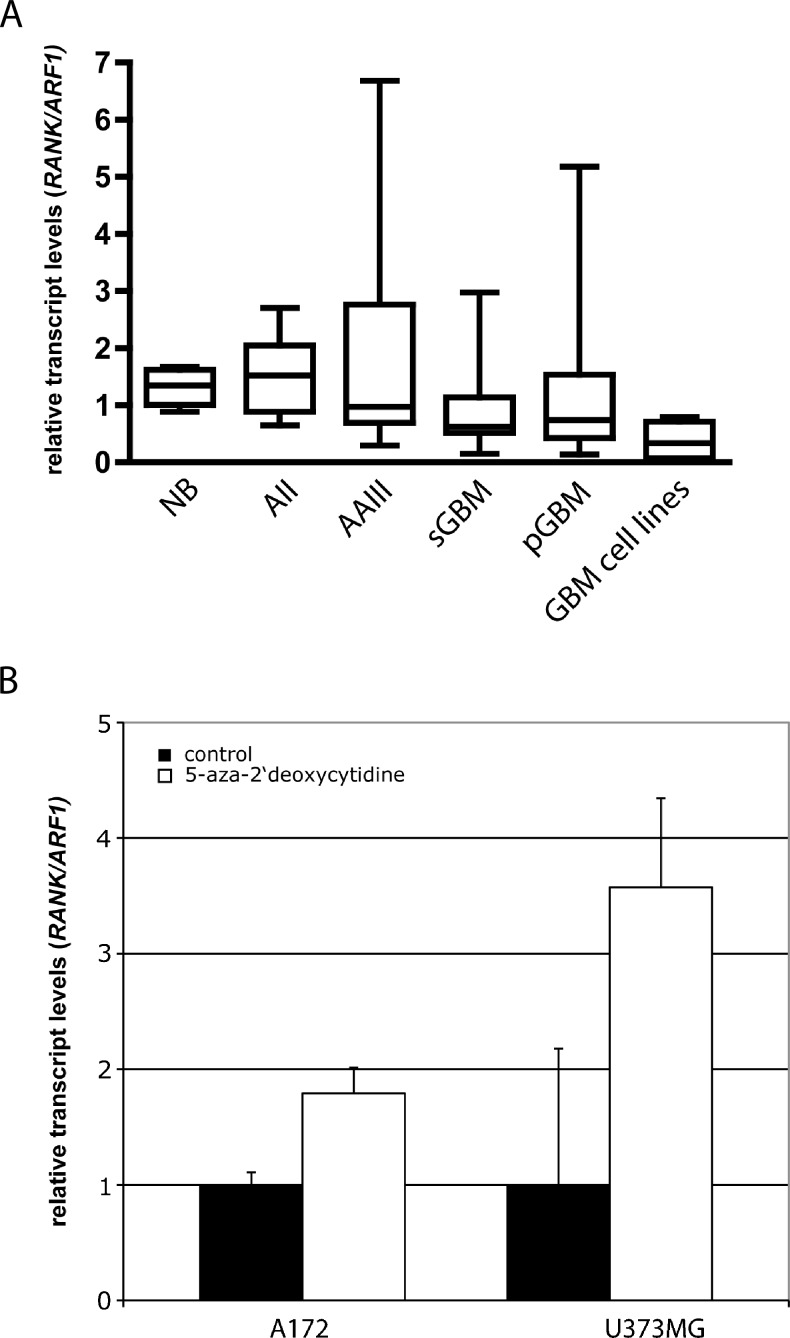
Figure 3.
Relative transcript levels of RANK/TNFRSF11A (RANK/TNFRSF11A/ARF1) analyzed by real-time RT-PCR in gliomas, glioblastoma cell lines, and normal white matter tissue (A). Relative transcript levels of RANK/TNFRSF11A in glioblatoma cell lines with (□) or without (■) 1 and 5 µM 5-aza-2′-deoxycytidine treatment (B).

