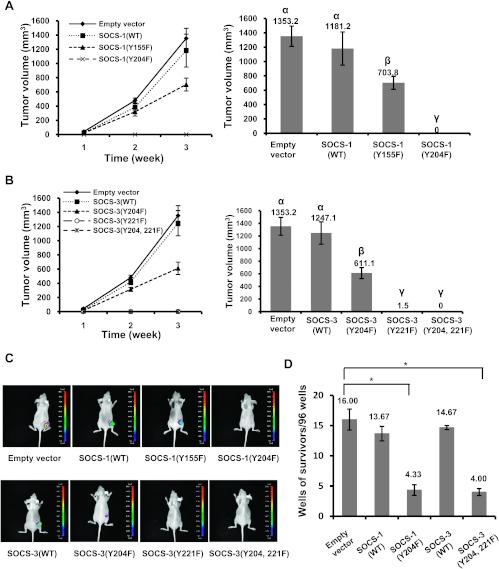
Figure 7.
Decreasing tyrosine phosphorylation levels of SOCS-1 or SOCS-3 efficaciously inhibits tumor formation in mouse model and transformation of primary murine bone marrow cells. (A) Nude mice were subcutaneously injected with K562 cells stably expressing empty vector, SOCS-1(WT), SOCS-1(Y155F), or SOCS-1(Y204F). The mice were monitored for visible signs of tumor growth, and tumor volumes were measured at indicated time points. The groups labeled by letter a are different from the ones labeled by letter b at the significant level of P ≤ .01, and the groups of a and b are different from the ones labeled by letter c at the significant level of P ≤ .001. Plotted are the results from three independent experiments. Error bars, SD; n = 16. (B) Nude mice were inoculated with K562 cells stably expressing empty vector, SOCS-3(WT), SOCS-3(Y204F), SOCS-3(Y221F), or SOCS-3(Y204, 221F). Tumor growth was analyzed as described in A. Letters a, b, and c indicate the mean values that are different at the significant level of P ≤ .001. Error bars, SD; n = 20. (C) Nude mice were subcutaneously injected with K562 cells as described in A and B. Over a 14-day period after inoculation, tumors formed by K562 cells stably expressing empty vector (GFP), wild-type, or mutant SOCS-1 (upper panel) and wild-type or mutant SOCS-3 (lower panel) were measured by bioluminescent imaging. Shown are representative images from several experiments with similar results. (D) Bone marrow cells from Balb/cmice were infected with retroviruses expressing Bcr-Abl and GFP, SOCS-1(WT), SOCS-1(Y204F), SOCS-3 (WT), or SOCS-3(Y204, 221F) and plated on 96-well plates. Transformation efficiency was scored as described in Materials and Methods. Plotted are the results from three independent experiments. Error bars, SEM; n = 3. *P < .01.

