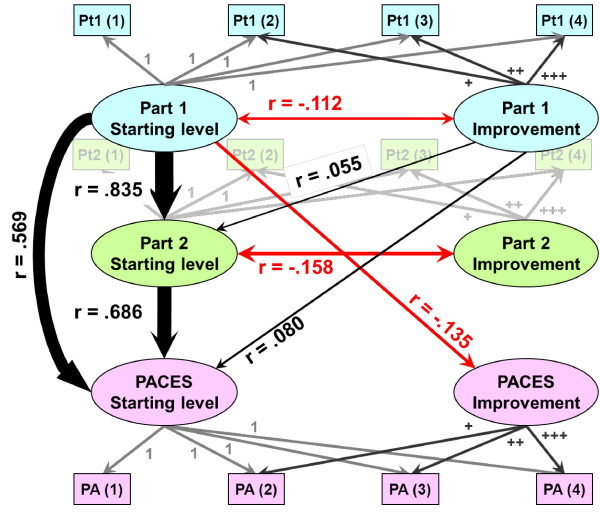
Figure 11.
A summary of model M6, which uses MLwiN to fit nonlinear growth curves simultaneously to the first four attempts at Part 1, Part 2 and PACES (see text for method). The raw measures are shown as small rectangles (Pt1(1), for the first attempt at Part 1, and so on), but for clarity are made very faint for Part 2. The six random variables indicating different starting values and rates of improvement at each of the three examinations are shown in the ovals. Correlations between the random variables are shown as double-headed arrows for effects within an examination and single-headed arrows where one examination normally takes place ahead of another examination, and the correlation can be interpreted causally. The strengths of correlations are shown by the thickness of the lines, with positive correlations in black and negative correlations in red. MLwiN, Multilevel Modelling for Windows; PACES, Practical Assessment of Clinical Examination Skills.

