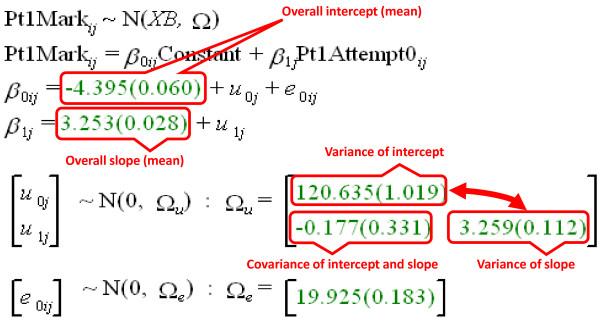
Figure 9.
Annotated output from MLwiN to show fitting of model M4, in which there is linear growth across occasions, and also random variation across candidates in the slope and intercept, and covariation between the slope and intercept. Annotations on the output are shown in red. MLwiN, Multilevel Modelling for Windows.

