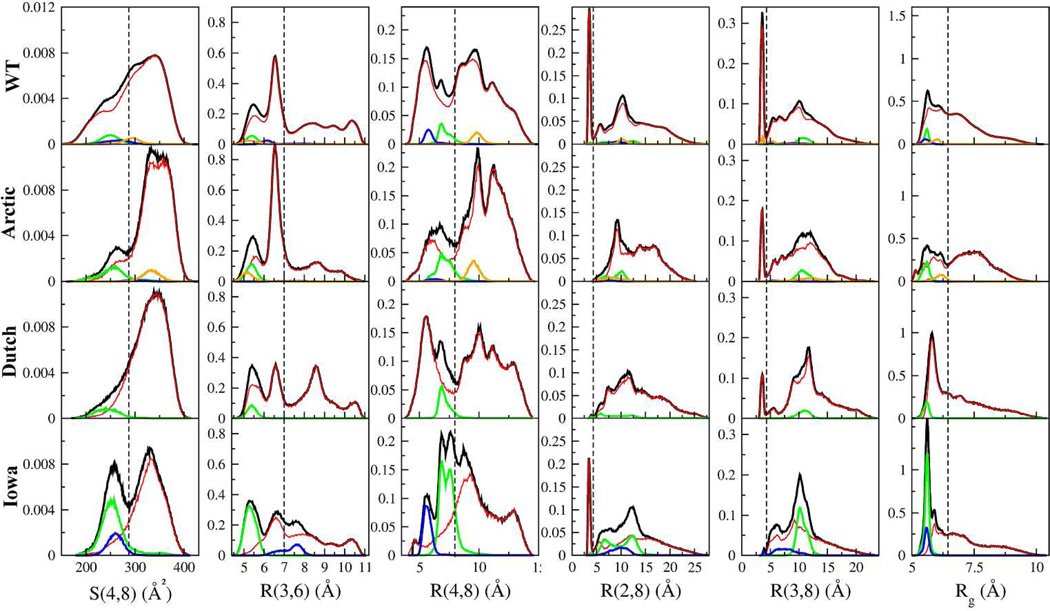
Figure 3.
Normalized histograms of S(4,8), amino acid distances R(x,y), and radius of gyration Rg per mutation. Black lines correspond to each quantity calculated using entire trajectories, while blue, green, and orange lines are the individual contributions to the histograms from the β28, β29, β18 hairpins respectively. The red lines correspond to the histograms calculated excluding the β-hairpins. The dashed vertical lines used to demarcate regions in S(4,8), R(3,6), R(4,8), R(2/3,8), and Rg are at 287 Å2, 7 Å, 8 Å, 4.2 Å, and 6.3 Å, respectively.

