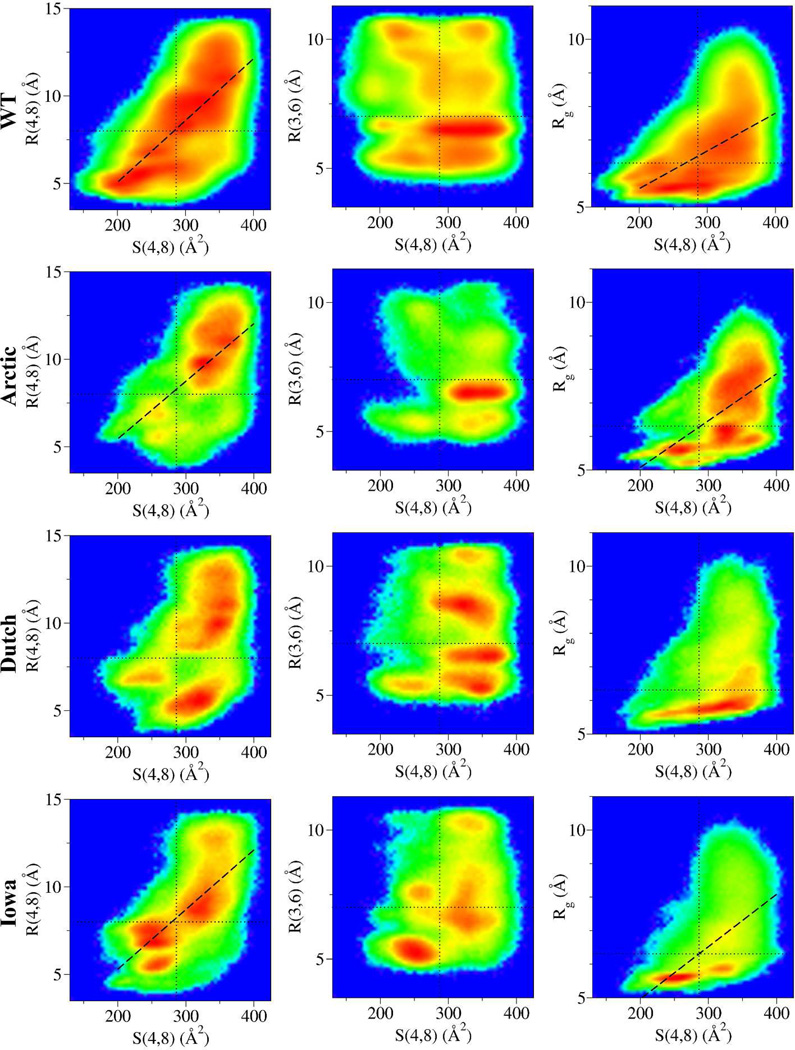
Figure 4.
Two-dimensional maps corresponding to the normalized logarithm of the number of configurations G[S,R] plotted according to their R(4,8), R(3,6), and Rg vs S(4,8) values using the data from Figure 3. The rainbow colormap corresponds to the highest number of conformations (red) to zero conformations (blue). Thus, a point in a map with value G[S,R] that is red indicates that that particular pair of R(x,y) and S(4,8) is populated by the maximum number of conformations. The dashed lines are linear regression fits to the data for only those data exhibiting significant correlations. For the WT G[S(4,8),R(4,8)] the Pearson correlation coefficient, r, is r = 0.71 and for the G[S(4,8), Rg] it is r = 0.57. For the Arctic G[S(4,8), R(4,8)] the correlation coefficient is r = 0.59 and for the G[S(4,8), Rg] it is r = 0.55. For the Iowa G[S(4,8), R(4,8)] the correlation coefficient is r = 0.68 and for the G[S(4,8), Rg] it is r = 0.63. The thin dotted vertical lines in the S(4,8) axis are centered at 287 Å2, while the horizontal lines at the R(4,8), R(3,6), and Rg axes are at 8, 7, and 6.3 Å, respectively.

