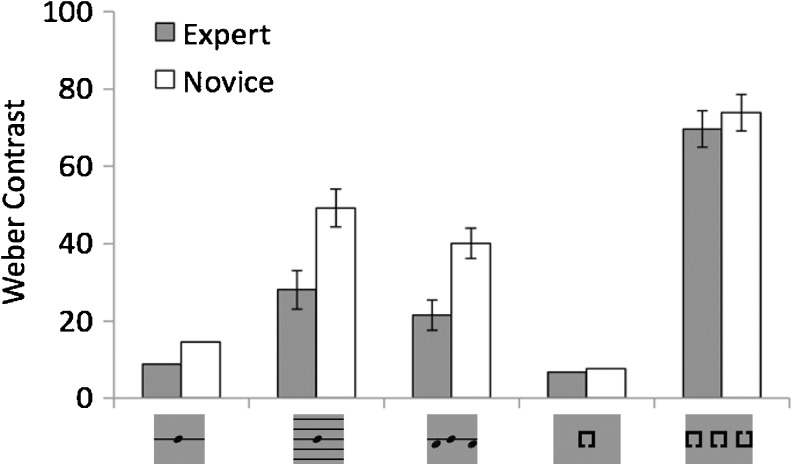
Fig. 1.
Contrast thresholds for all of the baseline or crowded conditions. Error bars plot the 95% confidence intervals (CIs) for the Group × Crowding results for each type of crowding. Error bars for the baseline conditions were omitted because they were associated with different sets of error bars in different ANOVAs

