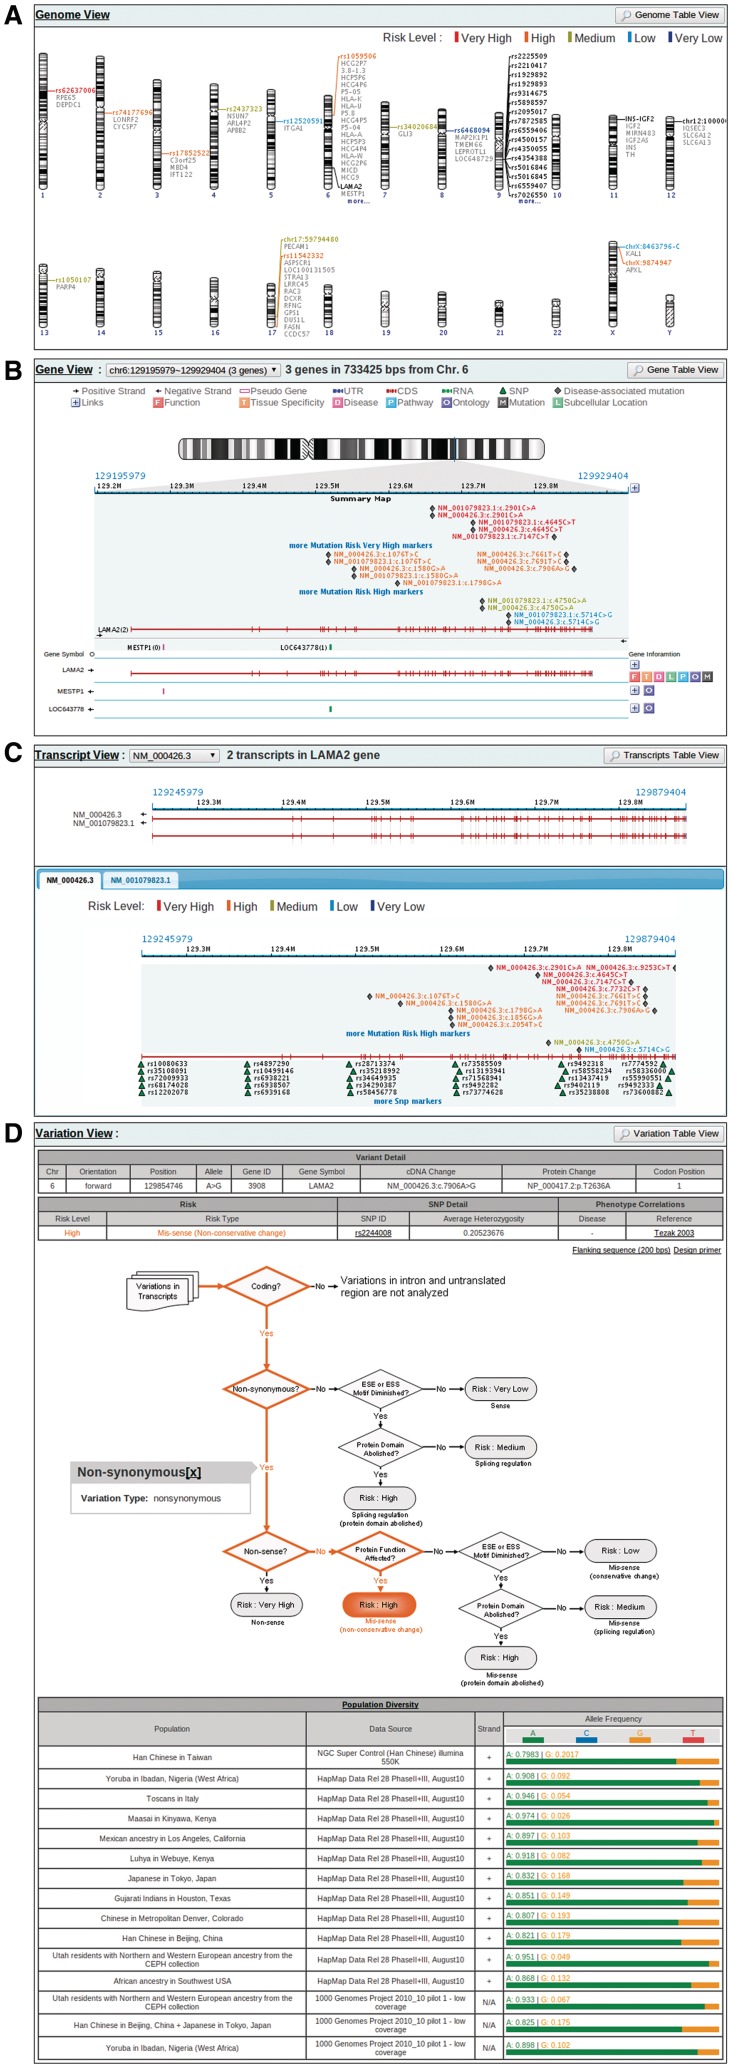
Figure 2.
Example output pages for visualized annotation result. (A) Genome View provides a bird's-eye-view of the query result on the genome scale. It shows the distribution of the query items on the whole genome, and colours each item according to the risk level analyzed based on the annotation results. (B) Gene View displays each query item in the context of genes and mutations known to cause diseases. In addition to providing a diagram representation of gene structures, including introns and exons, it also annotates each gene within the view-port with known functions, tissue specificity, ontology, pathway involved and disease caused. Disease-relevant mutations are also revealed. This view was designed with the aim to expedite gene-relevant literature searching. (C) Transcript View displays a query item in the transcript context. Since one variant may have different effects on different transcript isoforms, this view provides a precise genomic context in which the query item is analyzed. Transcript View also depicts known SNPs within the specified transcript along with disease-relevant mutations. (D) Variation View shows the annotation details of a query item, the decision tree of risk evaluation, and the relevant allele frequencies in different human races.

