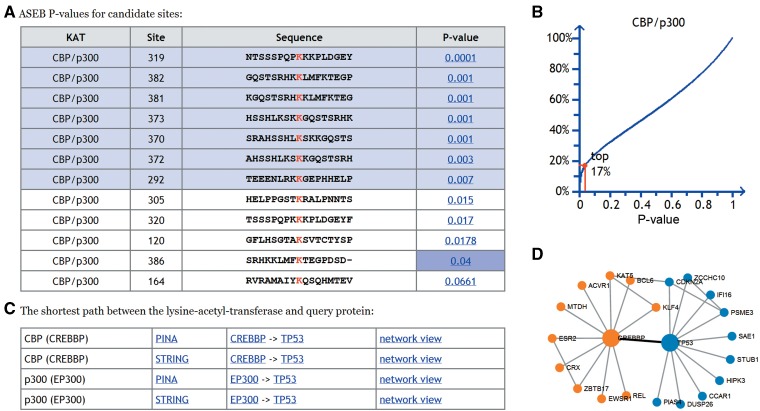
Figure 1.
Prediction results for human protein TP53. (A) Table containing predicted P-values for each lysine site on TP53. The sites with lower P-values in the top 10% were highlighted by background color. (B) Plot showing the rank of P-value 0.04 from the background. The X-axis indicates the P-value, and the Y-axis indicates the rank of this P-value. (C) Shortest path between the lysine-acetyl-transferase (CREBBP) and the query protein (TP53). (D) Example of the PPI network view. The shortest path between the lysine-acetyl-transferase (CREBBP) and the query protein (TP53) is highlighted by the bold black line.

