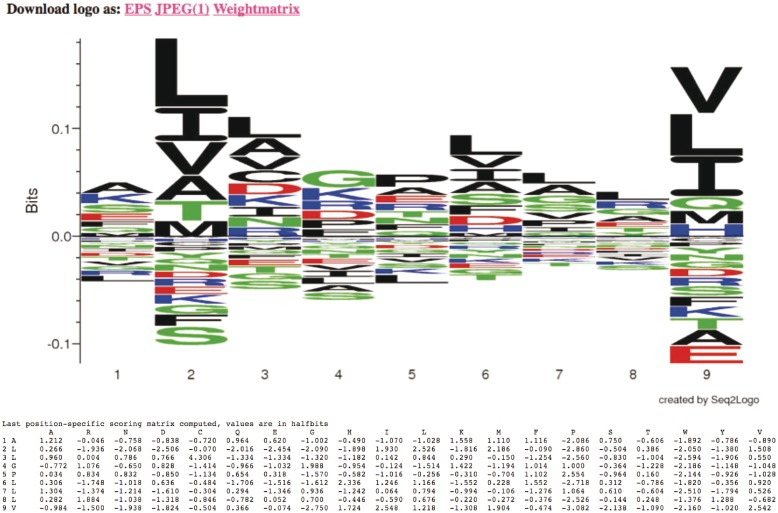
Figure 2.
Output from Seq2Logo. The upper panel shows the sequence logo calculated from a set of 13 artificial peptide sequences using the specification defined in Figure 1 (sequence weighting using clustering, pseudo count with a weight of 200 and logotype as Kullback–Leibler). Enriched amino acids are shown on the positive y-axis and depleted amino acids on the negative y-axis. The lower panel gives the position-specific (log-odds) scoring matrix (PSSM) calculated by Seq2Logo. Each line corresponds to a position and gives the consensus amino acid and the log-odds scores for the 20 amino acids.

