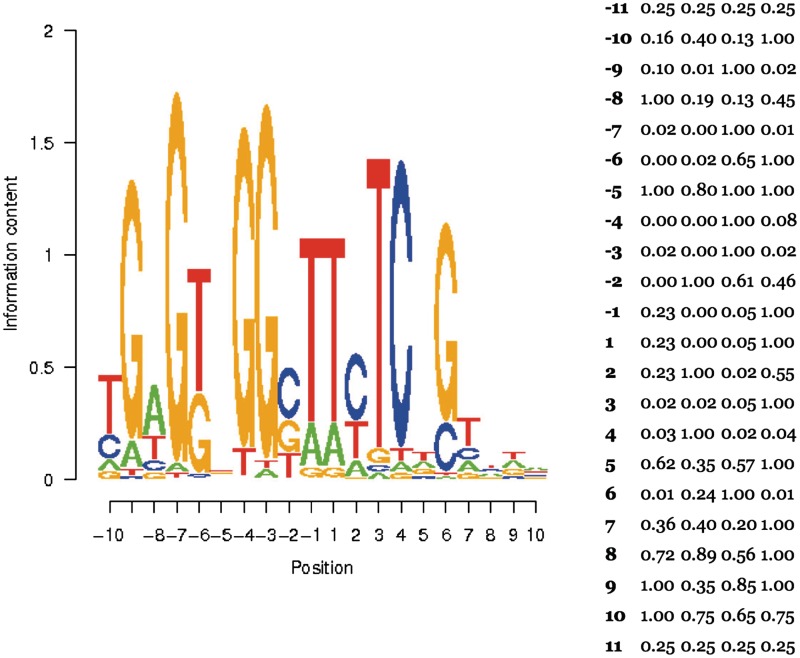
Figure 1.
The specificity profile (PWM) for the I-AniI LHE. Specificity profiles, reported as PWMs that have been experimentally determined for a number of LHEs can be entered individually and are available on the site as part of the browser functionality. These matrices are displayed in graphical format as a sequence logo plot (left) and in tabular format. The ability of the enzyme to cleave DNA targets that contain a given nucleotide at a specific position within the target site is indicated by letter height, and positions with greater overall information content are more specifically recognized. The profile displayed in this figure was determined in a series of biochemical experiments where the cleavability of target site variants was individually measured (34).

