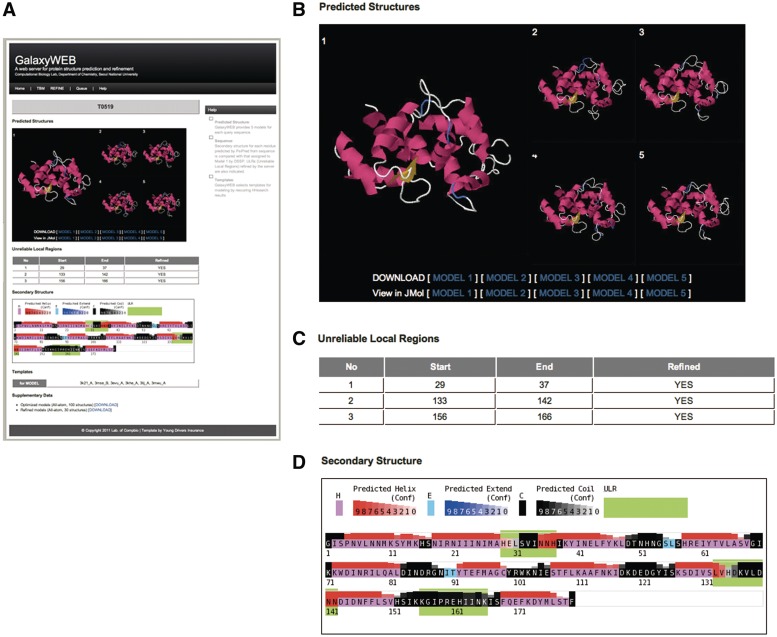
Figure 2.
GalaxyWEB output page (A). Five top-ranking models are shown in static images (B). They can also be viewed using the Jmol structure viewer. The residue ranges of the refined ULRs are summarized in the table (C) and also indicated in the secondary structure figure (D) in which secondary structure of the first model is compared with the prediction obtained from sequence using PSIPRED.

