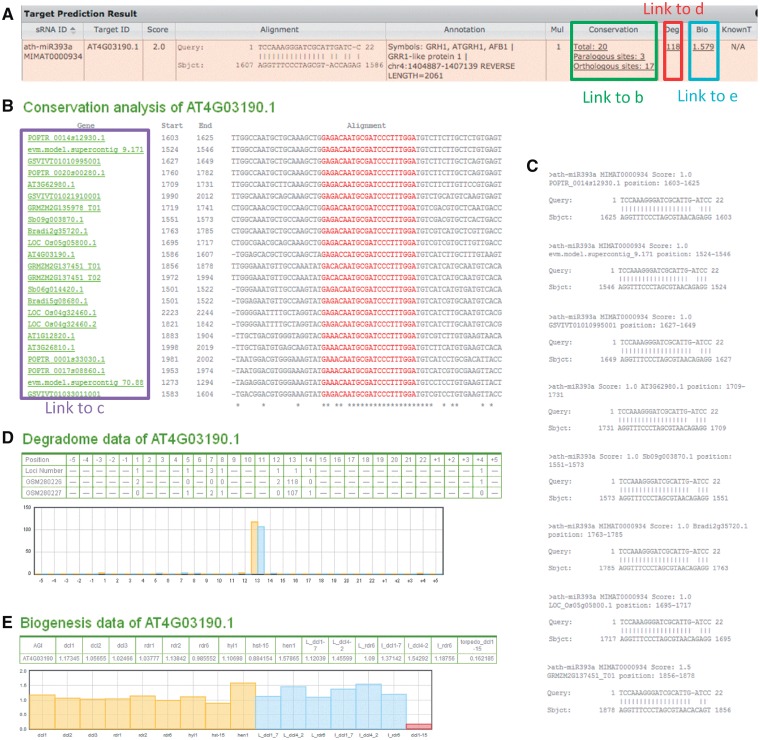
Figure 3.
Illustration of expandable links in the target prediction result table. (A) A sample line of the target prediction result table; (B) target site conservation analysis results. Homolog genes with the same smRNA target site, both within and cross-species, are shown in the ClustalW multiple alignment format; (C) the alignments between miRNA and targets provoked by mousing over the hyperlinks of gene IDs listed in (B); (D) Degradome data of the predicted smRNA target. Positions listed in the table are orders of nucleotides in the smRNA sequences, plus upstream and downstream 5 nt each; ‘Loci number’ represents the number of perfectly mapped loci of each degradome sequence, marked at the start nucleotide position of each sequence. Normalized reads starting at each nucleotide position in the degradome data are listed in following rows. The histogram shows the distribution of the degradome reads. In the example, the target should be cleaved after the 12th nucleotide according to the degradome data; (E) Expression change of target gene in smRNA biogenesis pathway gene mutants compared to wild-type plants. Fold changes of the normalized expression values between mutants and wildtype are shown in the table and the Y axis of the plot. Data from different datasets are distinguished by colors in the plot.

