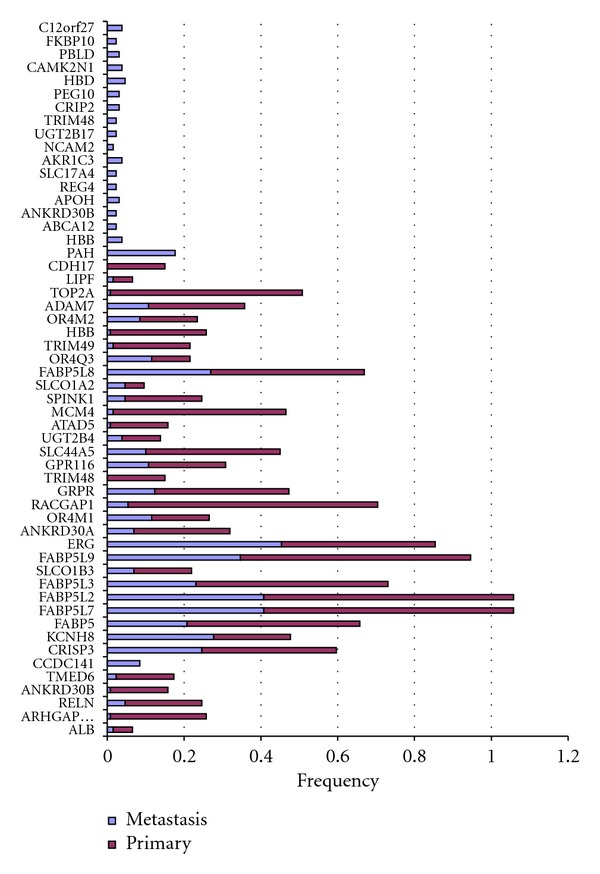
Figure 4.

Genes altered in prostate samples, 54 genes are selected as overexpressed in subset of samples (primary or metastatic). Some genes showed to be overexpressed in only metastatic samples (genes with all red bars). Other genes showed to be overexpressed in both primary and metastatic but not normal samples (genes with red and blue bars). The frequency on the axis is the fractions of samples with rearrangement (overexpression in subset of samples) over all samples size. The red bars for example represents the frequency of gene rearrangement in primary samples.
