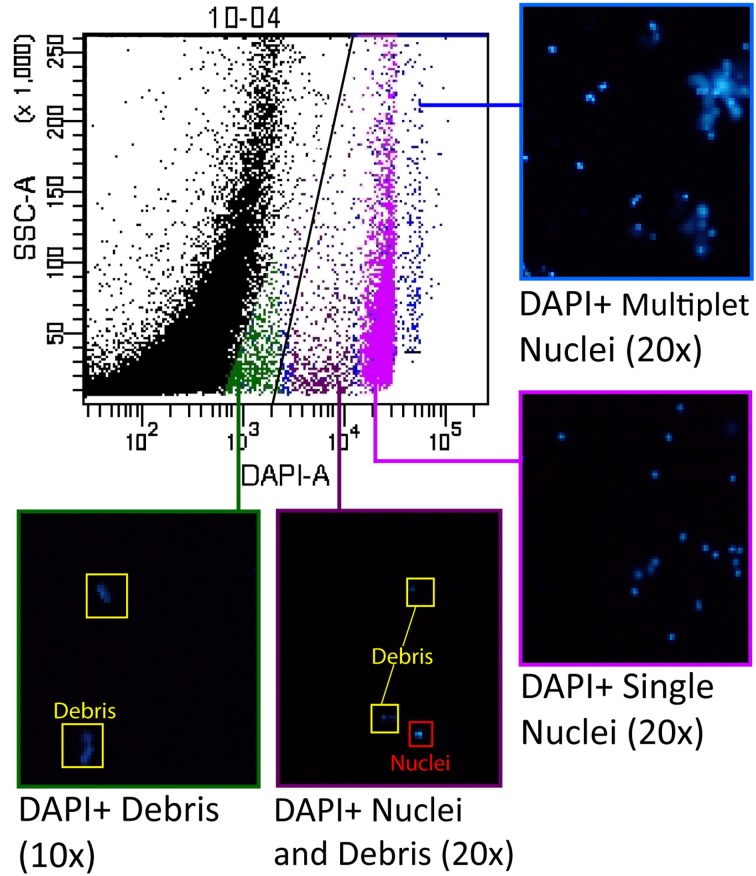
Figure 2.
Groups of nuclei were selected from the scatterplot for analysis by cell sorting to ensure optimal nuclei gate placement. Groups of nuclei resulting from the sort were examined under a fluorescence microscope to identify the characteristics of each of the major subpopulations visible on the scatterplot. The area of the scatterplot indicated in blue contained primarily multiplets of nuclei (“doublets”, “triplets”, etc.), while the area indicated in pink contained the DAPI positive “singlet” nuclei that were brightly labeled. The area of the scatterplot indicated in purple contained some debris, but also a population of dimly labeled and irregularly-shaped nuclei. The scatterplot area indicated in green contained only debris.

