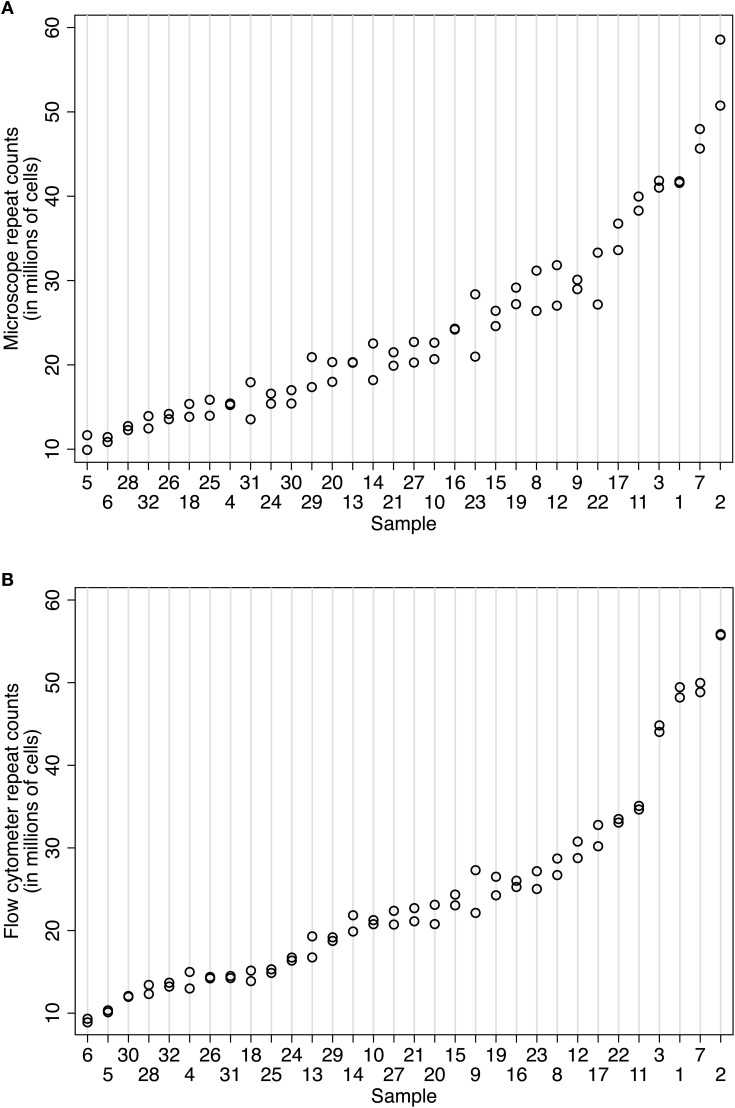
Figure 3.
Comparison of repeatability measures using (A) the isotropic fractionator and (B) the flow fractionator. In both panels, the samples are organized along the x-axis by increasing mean cell density. The number of nuclei counted in a sample is indicated on the y-axis. Each count is represented by one circle. The same aliquot was counted at least twice to isolate error associated with repeat counting from the same sample (i.e., counting error). Two sets of 32 samples from case 11-31 were prepared for this repeatability measure. (A) Repeated cell estimates using the isotropic fractionator produced an intraclass correlation of 0.96 (95% CI 0.934–0.988). The within-sample standard deviation was 2.2 million cells. (B) Repeated cell estimates using the flow fractionator for case 10-04 used two sets of 28 samples and produced an intraclass correlation of 0.99 (95% CI 0.984–0.997) and a within-sample standard deviation of 1.16 million cells.

