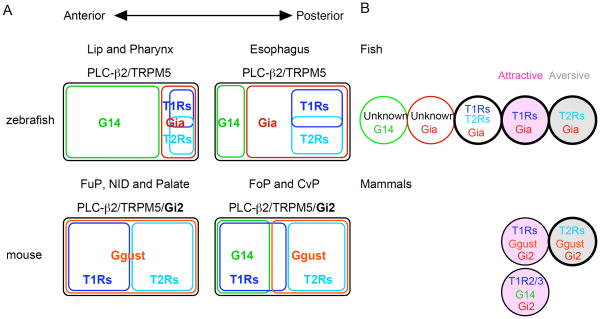
Fig. 10. Schematic comparison of PLC-β2/TRPM5-expressing taste receptor cells between zebrafish and mouse.
A, Schematic representation of the expression correlation of G alpha and taste receptor genes and their spatial differences in TRCs expressing both PLC-β2 and TRPM5. Co-expression of Gi2 in these TRCs in mammals is shown in bold above the schemes. B, Schematic representation of the variation in TRCs expressing both PLC-β2 and TRPM5. TRCs are depicted as circles, and the G alpha subunits and taste receptors expressed within them are indicated. T1Rs-and T2Rs-expressing TRCs related to attractive and aversive behaviors are shown in pink and gray, respectively. Bold circles indicate greater variety due to the expression profiles of T1Rs in fish and T2Rs in human. Newly identified subsets of TRCs in fish likely express GPCRs other than the currently known chemosensory receptors, including V2Rs, V1Rs, ORs, TAARs, and ORAs which are expressed in olfactory receptor neurons.

