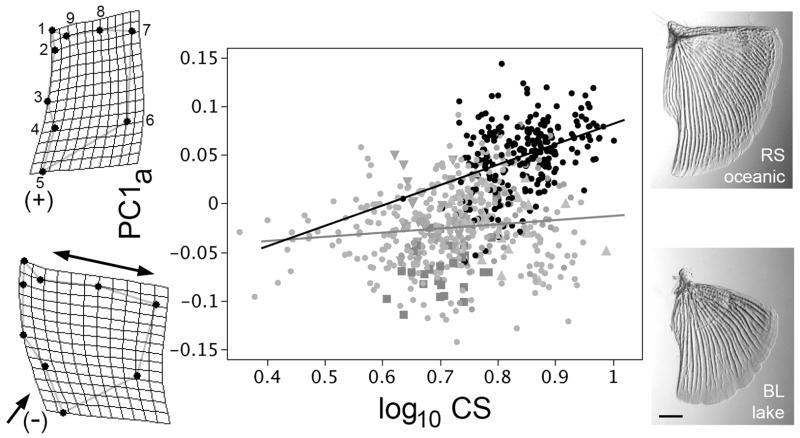
Fig. 1.
Evolutionary (phyletic) opercle allometry differs in sticklebacks that have diverged from oceanic to freshwater habitats. The data points on the allometric (shape versus size) plot show the first principal component of opercle shape (PC1a, explaining 46% of the total variation in shape) regressed on opercle size (centroid size, CS) of individual adult fish (n=744) collected in the wild from 22 separate populations, with black points representing fish from 8 oceanic populations, and the gray symbols representing fish from 14 freshwater populations; we recently described in detail the opercle shapes (but not sizes) from the same dataset (Kimmel et al., 2012). Distinctive symbols and are used for three freshwater populations singled out below, Boot Lake (Alaska, squares), Skorraddalsvatn Lake (Iceland, downward pointing triangles) and Paxton Lake (benthic population, from British Columbia, upward pointing triangles). Ordinary least squares (OLS) regression lines are shown, black for the oceanic fish and gray for the freshwater fish, the slopes differ significantly (see text). The thin plate spline diagrams to the left show shape deformations at positive (upper, corresponding to the oceanic morph) and negative (lower, corresponding to the freshwater morph) extremes along the PC1a axis. Double headed and single headed arrows show the characteristic dilation-diminution deformation in opercle shape at low PC1a, and associated with evolution to freshwater habitats. The micrographs to the right show examples of Alizarin Red stained opercles dissected from Rabbit Slough (RS, oceanic) and Boot Lake (BL, freshwater) fish. Scale bar: 1 mm.

