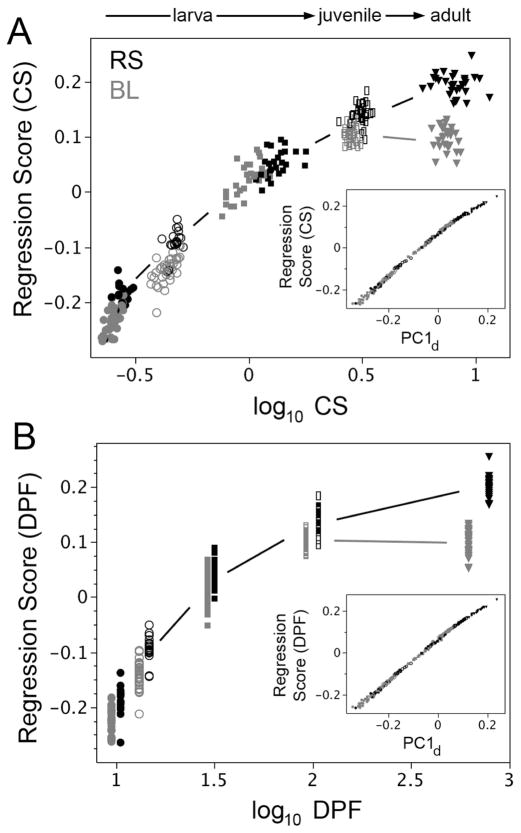
Fig. 3.
The most prominent opercle shape divergence between RS (black symbols) and BL (gray) occurs late in development, as revealed by multivariate regression of shape (Regression Score) on either opercle centroid size, CS (A) or DPF (B). This divergence occurs as juvenile fish (rectangles) grow to the adult stage (triangles). In agreement, the Procrustes distances at the adult stage show the largest difference between BL and RS (Table 1, stage matched comparisons). A less prominent difference, showing up particularly in the allometric plot (A) is that during larval stages (10 dpf: filled circles, 14 dpf: open circles, 30 dpf: squares) the rise in Regression Score is apparently greater in BL than RS. The insets in both A and B show the high correlation between these regression vectors (Regression Scores) and PC1d, the leading multivariate vector of total opercle shape variation in the RS (oceanic or ancestral) developmental data set.

