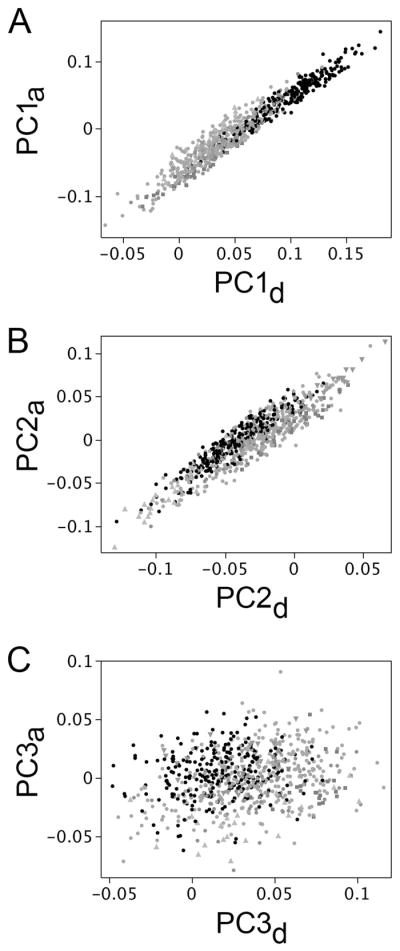
Fig. 4.

The leadings axes of opercle shape variation associated with evolutionary divergence and ancestral development line up. PC1a versus PC1d (A), and PC2a versus PC2d (B) both show high correlation. In contrast there is little or no correlation between PC3a and PC3d (C). The plots use the adult wild-captured dataset (the set shown in Fig. 1). Black points, oceanic populations. Gray points: freshwater populations.
