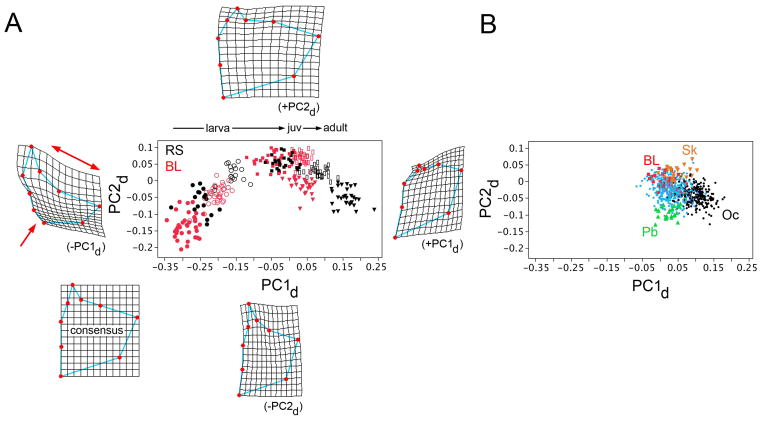
Fig. 5.
Plotting opercle shape developmental trajectories (A) and adult evolutionary trajectories (B) on the same space reveals the correlations between the two. (A) Opercle development in both RS (black symbols) and BL (red) follow similar but nonmatching curving trajectories through shape space, delineated by PC1d (horizontal axis) and PC2d (vertical). Different symbols represent five different developmental stages, as in the presentation in Fig. 3. The thin plate spline diagrams surrounding the plot show the consensus configuration (RS, computed from all of the developmental stages considered together), and deformations associated with extreme high and low values of both PCs. At low PC1d, characterizing the earliest developmental stages, the deformation shows dilation-diminution (red single- and double-headed arrows), i.e. it is of the same nature as the evolutionary shape change characterizing divergence from the oceanic to freshwater habitats (compare with Fig. 1 and Supplementary Fig. 2, and see Kimmel et al., 2012). (B) shows, for comparison with A, the adult wild-captured dataset plotted on the PC1d-PC2d space, with axes and scales matching A. Symbols match Fig. 1. BL: Boot Lake (red), Pb: Paxton Lake (green), benthic morph, Oc: oceanic (including RS and 6 other oceanic populations, black), Sk: Skorraddalsvatn Lake (orange). Other freshwater populations are in light blue.

