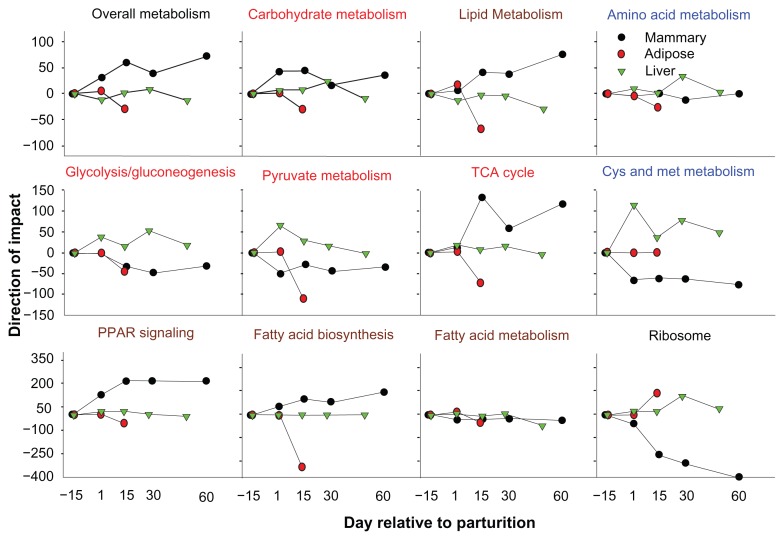
Figure 5.
Direct comparison of metabolic adaptations in mammary tissue, adipose tissue, and liver during the two last weeks of pregnancy until peak lactation.
Notes: The panel with bold black title depicts the direction of the impact of the overall ‘Metabolism’ category of KEGG pathways in mammary gland, adipose tissue, and liver of dairy cows from 2 weeks pre-partum to 2 months postpartum. The panels with bold red, brown, and blue titles depict the direction of the impact for the ‘Metabolism’ sub-categories ‘Carbohydrate metabolism’, ‘Lipid metabolism’, and ‘Amino acid metabolism’, respectively. The panels with regular font title depict the direction of the impact for selected pathways in the above KEGG pathways sub-categories plus the ‘PPAR signaling’ and ‘Ribosome’ pathways.

