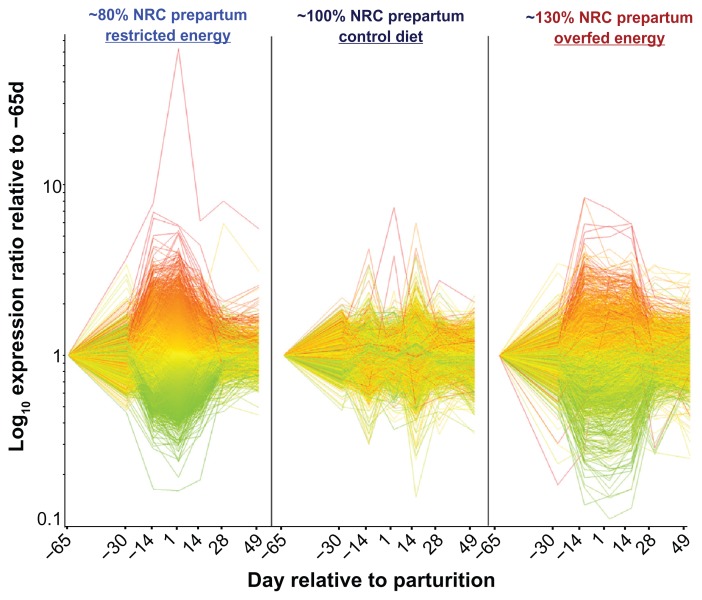
Figure 6.
Overall transcriptomics adaptation to different level of prepartum energy in bovine liver.
Notes: Shown is the image generated by Genespring GX7 (Agilent) of the genes deemed to be differentially expressed with time × treatment with false discovery rate <0.05. Dataset was a combination of two previously published microarray data19,35 generated by experiments were cows were fed diets to meet 150% (ad-libitum), 80% (restricted), or 100% (control) of energy requirements during the dry period. All cows were fed the same diet after parturition. Statistical analysis was run using Mixed model as described previously23 with time × treatment as main effect. Green and red lines denote genes with an expression ratio lower or higher at 1 relative to −65 d in the cows fed restricted energy prepartum. This allows to quickly visualizing the pattern of same group of genes in the other treatments. From the image is evident that the control diet had a mild effect while either the restricted or the ad-libitum energy prepartum had a strong effect on the transcriptomics adaptation to lactation.

