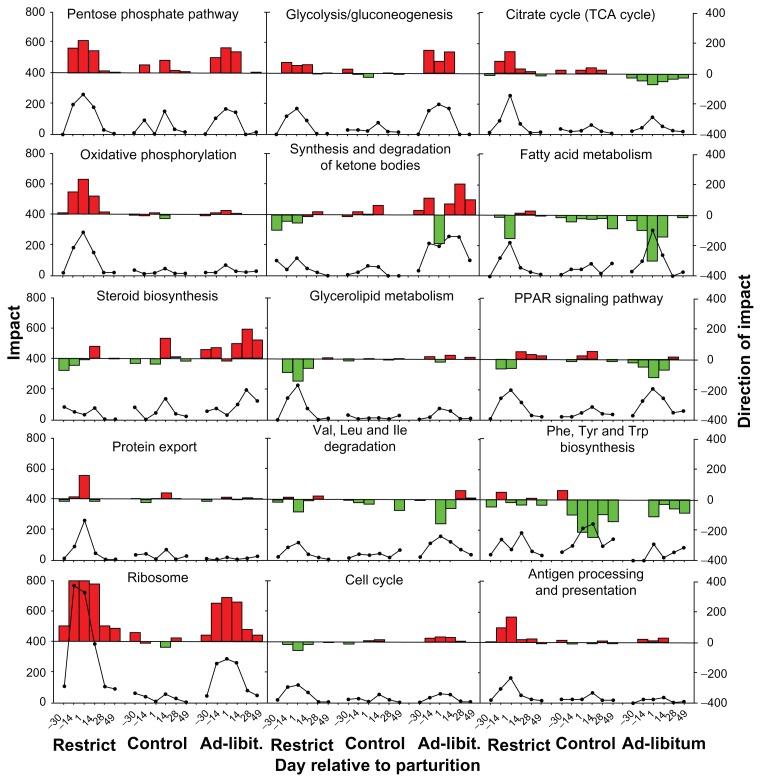
Figure 8.
Metabolic adaptations of bovine liver to different levels of dietary energy prepartum.
Notes: Reported are among the most impacted pathways related to metabolism in liver of cows fed different level of energy prepartum as described in caption of Figures 6 and 7. The lines in graphs depict the impact and the bars the direction of the impact as previously described.12 The red positive bars denote activation while the negative green bars inhibition of the pathway in each time point relative to −65 day relative to parturition as calculated by the DIA. Thresholds for analysis were false discovery rate ≤0.05 for the time × treatment effect, P ≤0.05 for each comparison, and at least 20% of genes in the pathways represented on the microarray.

