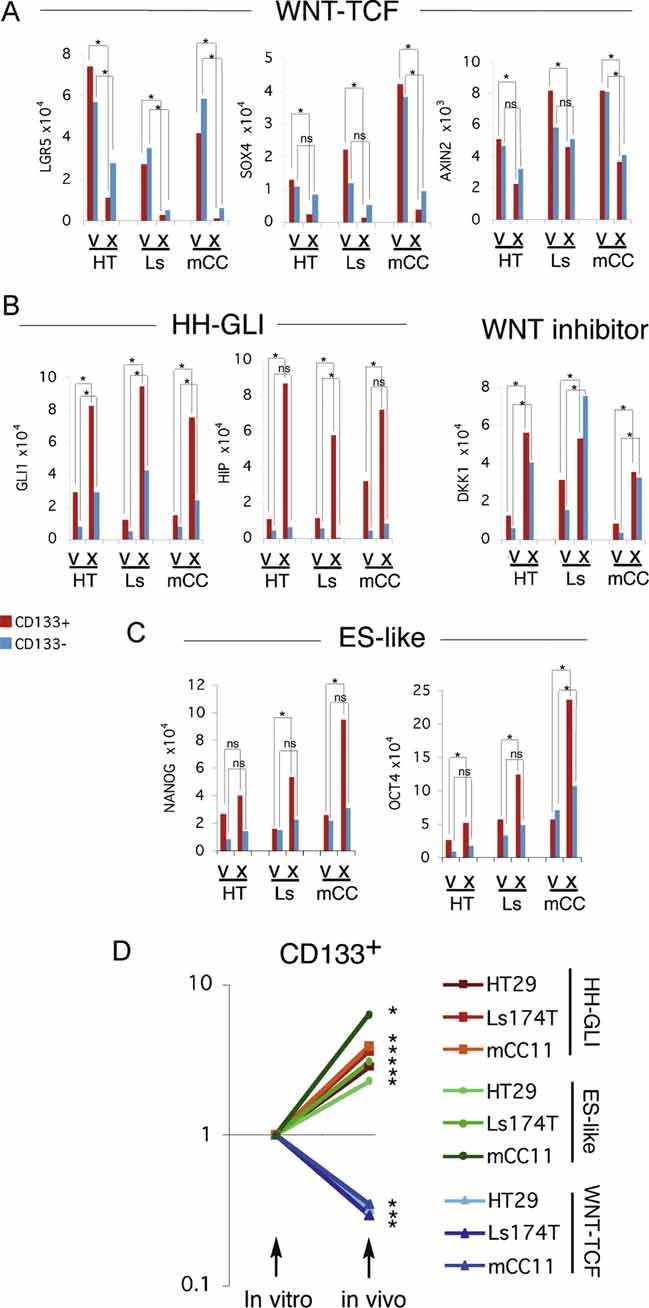
Figure 4. Differential expression of WNT-TCF and HH-GLI pathway components in CC cells in vitro versus in vivo in xenografts.

A–C. Histograms of individual gene expression changes determined by qRT-PCR for CD133+ (red bars) and CD133− (blue bars) cells, after normalization as in Fig 1, shown for selected WNT-TCF (A), HH-GLI (B) and ES-like stemness genes (C) in HT: HT29; Ls: Ls174T; mCC: mCC11 cells. v: in vitro culture; x; in vivo xenografts. Analyses of additional genes are shown in Fig S9. Error bars of s.e.m.'s are not included to enhance clarity. However, asterisks denote significant (p < 0.05) changes in Student's t-tests using PCR triplicates in each case. ns: not significant.
D. Logarithmic scale representation of averaged gene expression changes in CD133+ cells (cell lines Ls174T and HT29, and primary mCC11) cultured in vitro versus in vivo in xenografts. Primary data derived from (A) and Fig S9. The values for HH-GLI, βCAT/TCF and ES-like stemness signatures represent the averages, after normalization of the values of GLI1, GLI2, HIP and PTCH1 for HH-GLI, of LGR5, SOX4, AXIN2, cMYC and CD44 for WNT-TCF, and of NANOG, SOX2 and OCT4 for ES-like stemness, shown in panels A-C and Fig S9. In vitro levels were equated to 1 to normalize the graph, and in vivo levels were correspondingly adjusted. Asterisks denote significant (p < 0.05) changes between the same cell/signature averages in vitro versus in vivo. ns: difference not significant. Note the clear and strong differences in CD133+ cells.
