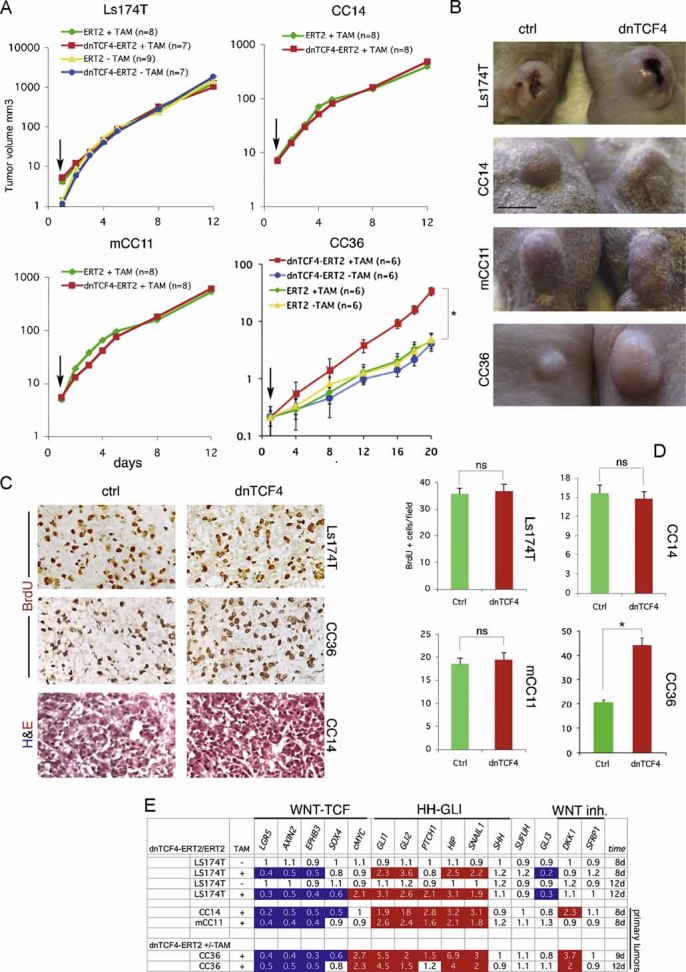
Figure 6. Effects of TAM-inducible TCF4 blockade in Ls174T and primary human CCs in xenografts in mice.

A. Growth curves of xenografts with Ls174T, CC14, mCC11 or CC36 cells carrying dnTCF4ERT2 or ERT2 alone with (+) or without (−) TAM treatment as indicated. Plots show logarithmic Y-axis scales. Arrows point to the beginning of TAM addition once the tumours were visible. Growth curves are overlapping except for those of CC36. ns: not significant in Student's t-tests. Error bars represent s.e.m.
B. Representative images of xenograft tumours of Ctrl (ERT2, +TAM) or dnTCF4 (dnTCF4ERT2, +TAM) taken at the same time.
C,D. Histological sections of xenografts shown in (B) displaying BrdU incorporation (brown in nuclei in top two rows, C) or morphology after H&E staining (bottom row, C), and quantification of cell proliferation (D). Asterisks denote significant (p < 0.05) changes in Student's t-tests. ns: not significant. Error bars represent s.e.m.
E. RT-qPCR analyses of human CC xenografts harvested 8-12d after continuous treatment with TAM (+) or vehicle (−) similar to those shown in (A and B). The values are ratios of human-specific gene expression levels after normalization between tumours expressing dnTCF4ERT2 over those expressing the control ERT2 part only with or without TAM as indicated. In the absence of induction by TAM the ratios are ∼1. White boxes denote values within the 0.7–1.4 range. Blue boxes with values equal to or smaller than 0.5. Red boxes with values equal to or greater than 1.5.
Scale bar = 5 mm (B), 100 µm (C).
