
Figure 6. Crosstalk with the Wnt pathway.
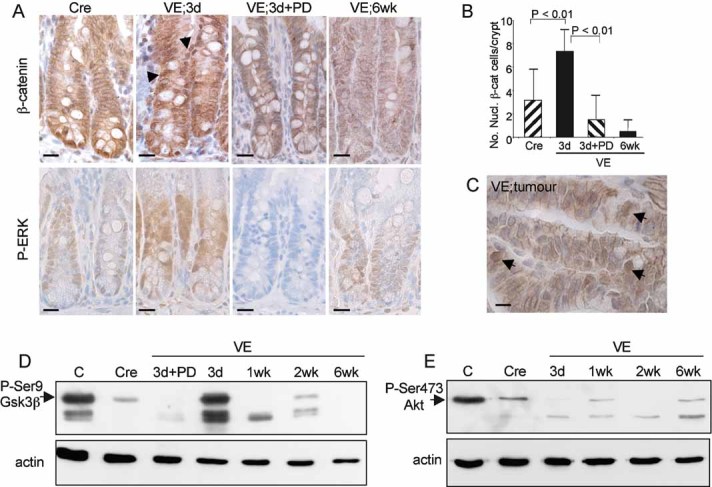
- Immunostaining of Cre control or VE-expressing gut samples at 3 days and 6 weeks p.i. as well as a 3 day sample treated with PD184352 with an antibody for β-catenin (top panels) or phospho-Erk (bottom panels). Sections were counterstained with haematoxylin. Nuclear β-catenin staining is indicated by black arrows. Bars = 10 µm.
- Quantitation of nuclear β-catenin positive cells. The bar chart represents the mean number of nuclear β-catenin positive cells/crypt ± SD from 100 full crypts counted from at least two mice of each genotype/treatment.
- Immunostaining of tumour with antibody for β-catenin. Arrows indicate cells with high levels of nuclear β-catenin. Bar = 5 µm.
- Western blot analysis of phosphorylation of Ser9 of Gsk3β in a control mouse embryonic fibroblast (MEF) sample (C), a Cre control gut sample and VE-expressing gut samples at 3 days–6 weeks p.i. The VE samples at 3 days p.i. treated ± PD184352 are the same as those analysed for phospho-Erk in Fig 3B.
- Western blot analysis of phosphorylation of Ser473 of Akt in a control MEF sample (C), a Cre control gut sample and VE-expressing gut samples at 3 days–6 weeks p.i.