
Fig. 2.
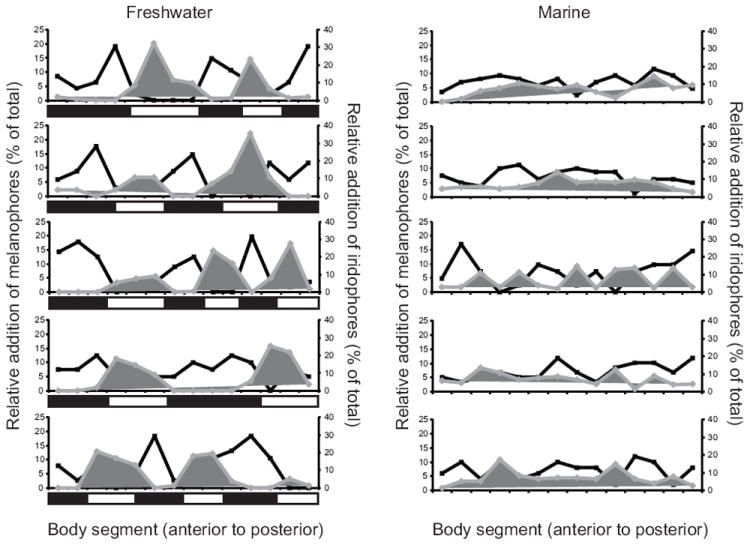
Patterning of melanophore and iridophore addition in marine and freshwater sticklebacks. The percentage of the total melanophores (black lines) or iridophore platelets (gray lines) that appeared between 9 and 19 dph are shown as a function of the body segment in which they appeared. Each graph represents a different fish. Freshwater fish are shown on the left and marine fish on the right. The rectangles below each freshwater graph depict the location of dark vs. light bars; the position and size of dark and light bars is variable across fish.