
Fig. 2.
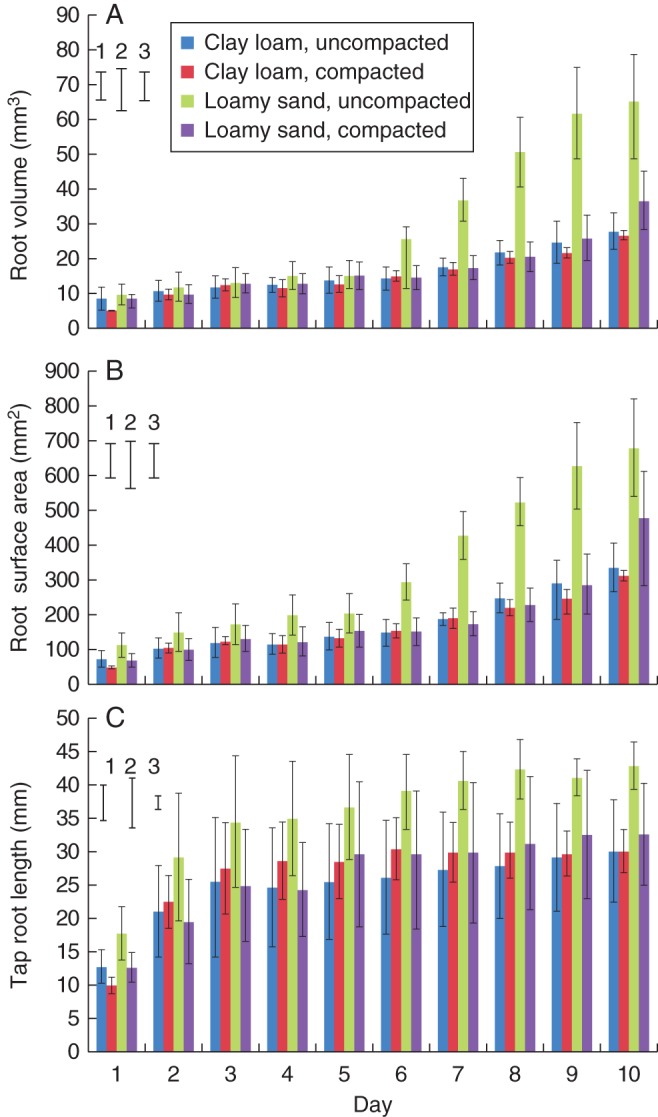
Semi-automated segmented mean values for (A) root volume, (B) root surface area and (C) tap root length during the 10-d observation period for both compaction treatments and soil types. Error bars associated with the histograms show double standard errors of the mean. Standard errors of the difference are shown for (1) soil type, (2) compaction treatment and (3) day.