
Fig. 9.
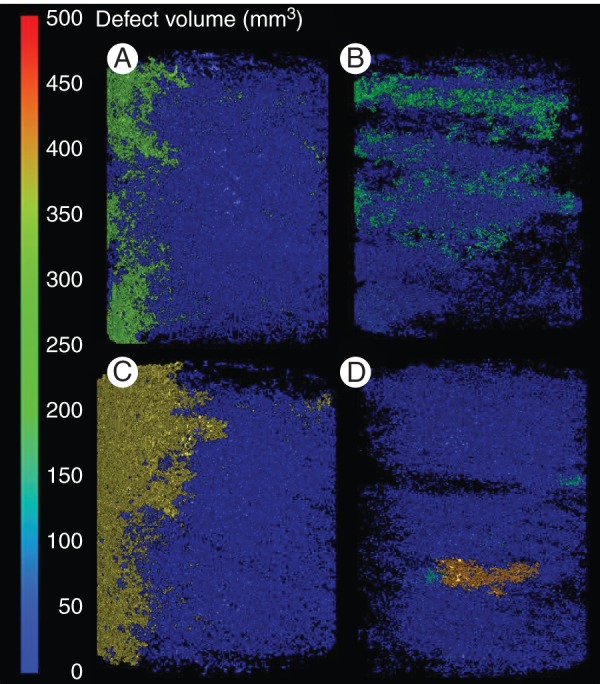
Soil pore architecture for uncompacted and compacted clay loam (A, B) and loamy sand soils (C, D) visualized using the Defect analysis tool in VGStudioMAX®. Blue areas show small unconnected pore space; green and orange areas are volumes of connected pores and equal the volume value on the scale bar. The intensity of colouration reflects the volume of connected pores.