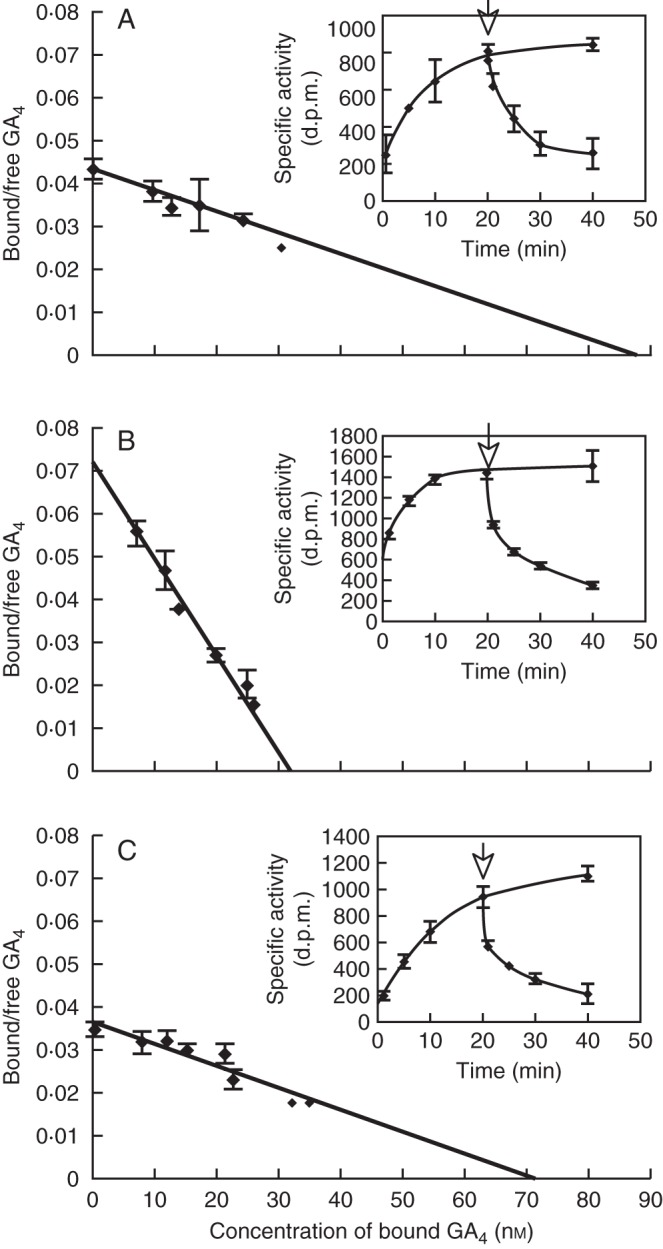
Fig. 13.

Association and dissociation kinetics of (A) AtGID1a, (B) AtGID1b and (C) AtGID1c. Dissociation constants of GID1a, b and c were calculated from GA binding kinetics of each AtGID1. Kd values are: (A) Kd(H2-GA4):AtGID1a = 2·0 × 10−6 m, (B) Kd(H2-GA4):AtGID1b = 4·8 × 10−7 m, (C) Kd(H2-GA4):AtGID1c = 1·9 × 10−6 m. AtGID1b shows a much lower Kd value than AtGID1a or AtGID1c. Insets show the time course characteristics for GA binding and replacement of AtGID1s with an excess amount of unlabelled GA4 (0·125 mm) (arrow). (Adapted from Nakajima et al., 2006.)
