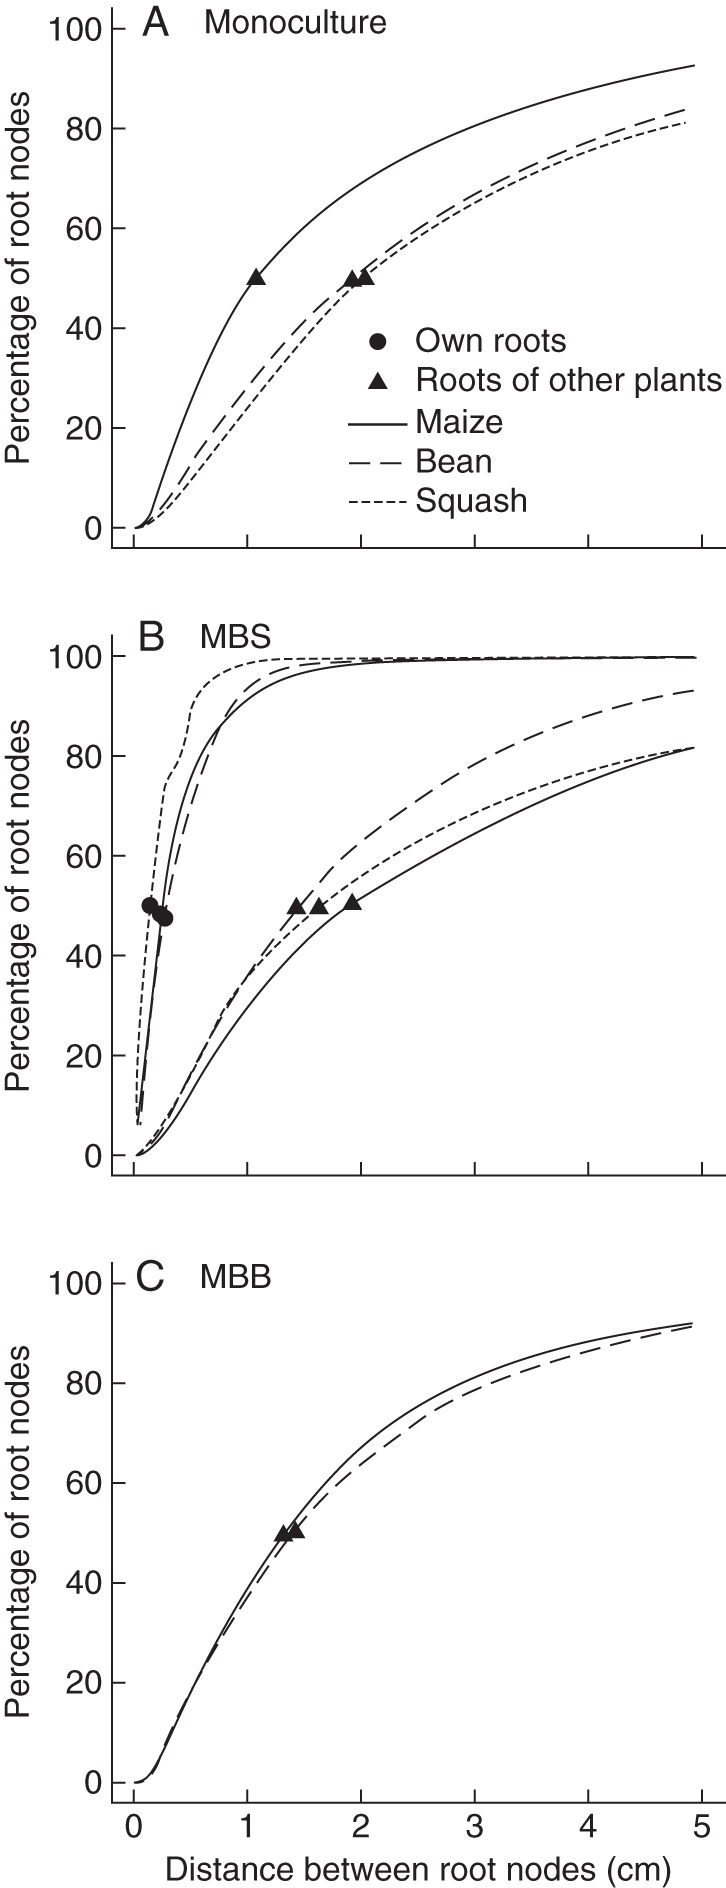
Fig. 11.

Cumulative distribution of the distance between a root node and the nearest neighbouring root node. Distributions are shown as a percentage of the root nodes of one plant and are shown for the distance between root nodes of different roots that belong to the same plant, labelled own roots, and roots that belong to a neighbouring plant. Distances to the roots of the same plant are only shown in the middle panel, as they are the same in all three systems. Distance to roots of other plants depends on the system. Results for different systems are plotted in different panels: (A) monocultures of three plants, (B) the ‘three sisters’ polyculture (MBS) and (C) the maize bean intercropping (MBB).
