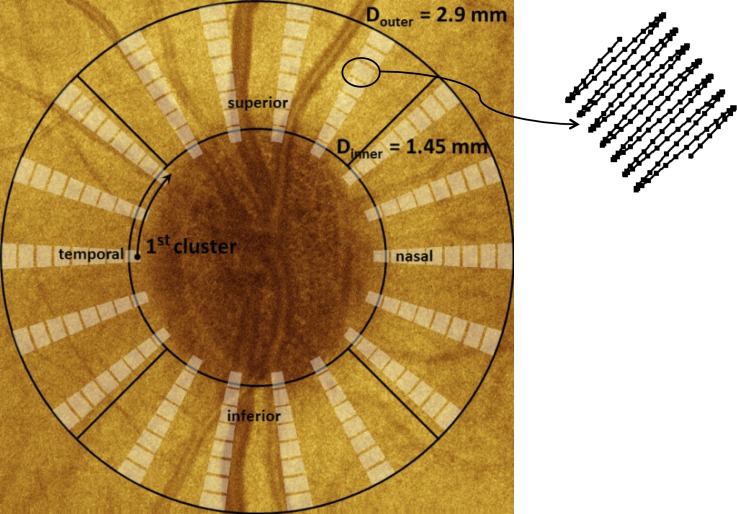
Figure 2. .
Schematic showing clustered imaging regions overlaid on a fundus image with marked quadrants. Sampling within a cluster is shown at the upper right. The clustered pattern collects 200 A-scans over a small region; these A-scans are averaged to reduce noise in estimates of the polarization parameters.

