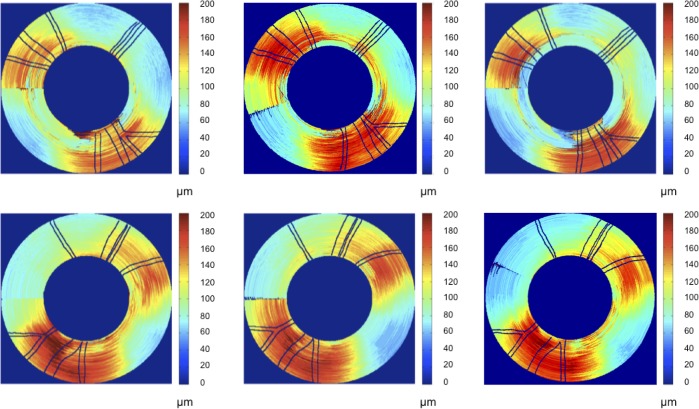
Figure 4. .
RNFL thickness maps for continuous ring scans for primate 2. Top row is OD (treated eye) and bottom row is OS (control eye). Time points correspond to beginning (left column, day 27), middle (center column, day 81), and end (right column, day 174) of the study. Blood vessels indicated by black lines.

