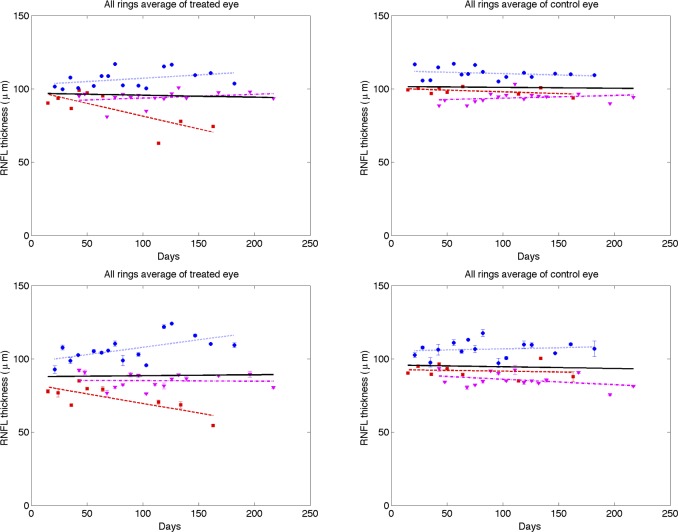
Figure 9. .
Time variation of averaged (all rings) RNFL thickness of treated (left column) and control (right column) eyes for continuous (top row) and clustered (bottom row) ring scans (squares, primate 1; circles, primate 2; and triangles, primate 3). Linear mixed effects model fits for individual primates (colored lines) and combined (all primates, black). Statistics for the combined data are shown in the Supplemental Material in Table S1 and the individual fits are included in Tables S2–S4 (http://www.iovs.org/content/53/8/4380/suppl/DC1).

