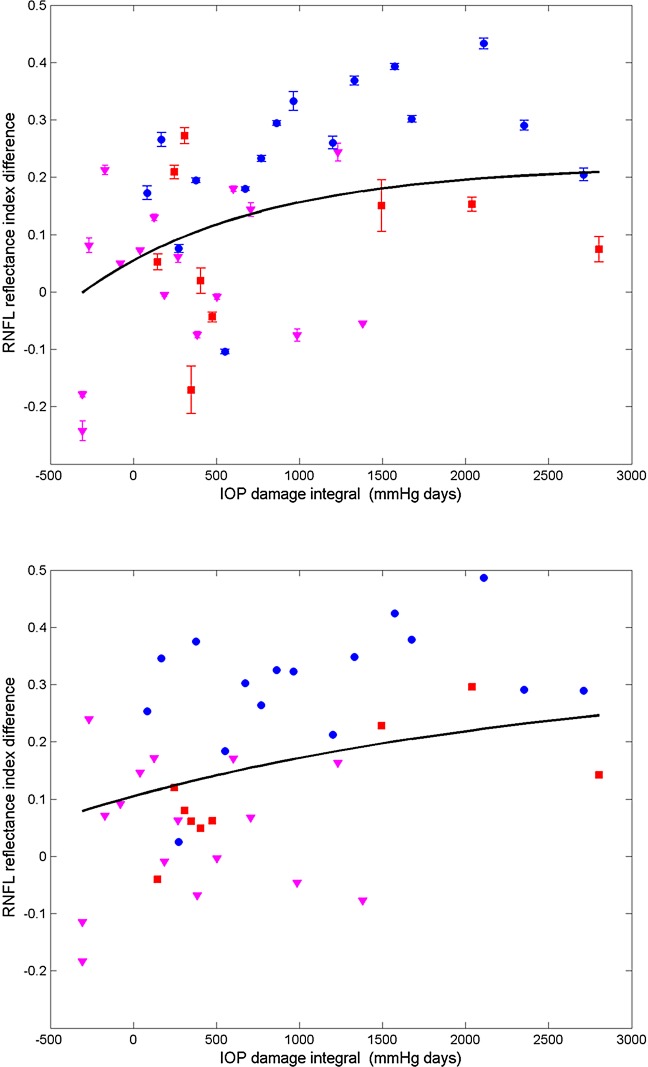
Figure 17. .
Average (all rings) of RNFLRI (RI) difference (control less treated) for clustered (top) and continuous (bottom) retinal scans versus IOP damage integral (squares, primate 1; circles, primate 2; and triangles, primate 3). Nonlinear mixed effects model fits (black curves) for clustered (τ = 1060.4, AIC = −39.4, BIC = −30.8) and continuous (τ = 2848.3, AIC = −52.0, BIC = −43.4) data for all primates.

