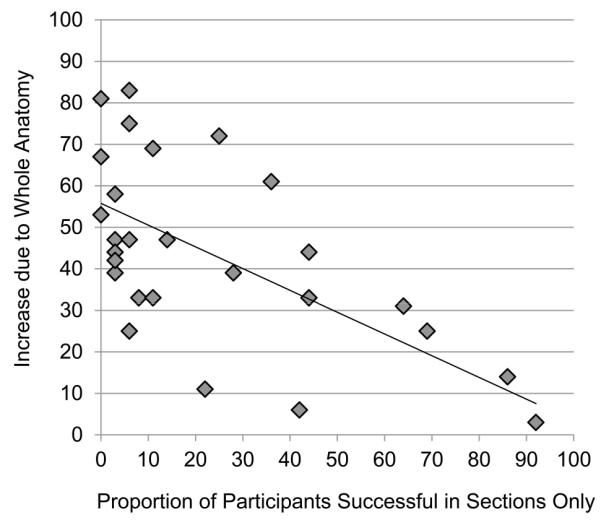
Figure 4.

Each point represents a single test item. The scatterplot shows the relationship between the proportion of participants answering each item correctly in the sections only group and the increase in proportion correct for that item in the whole then sections group.
