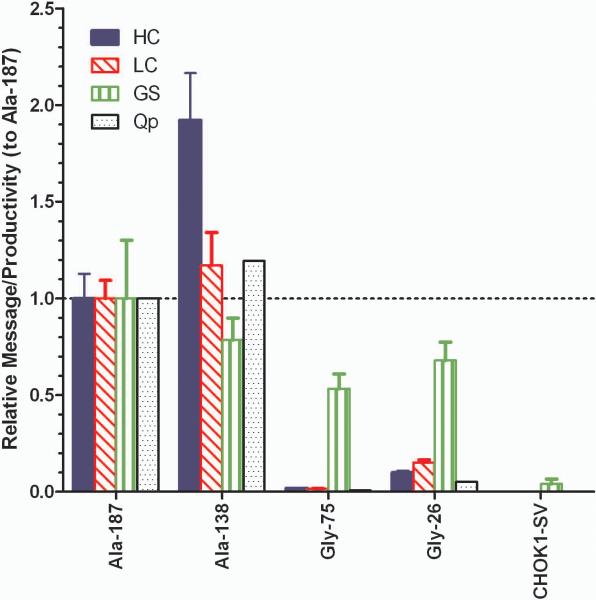
Figure 3.
Message expression and specific productivity (Qp) in mAb 277 Ala and Gly stable cell lines. Message levels for HC, LC, and glutamine synthetase (GS) were measured by qPCR from batch cultures on day 4. The message levels of each gene were normalized to the amount present in the Ala-187 sample and error bars are ±1 standard deviation (n=3).

