Figure 6.
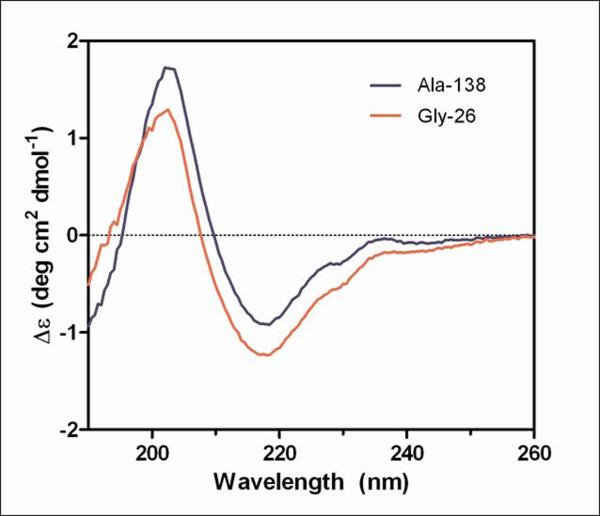
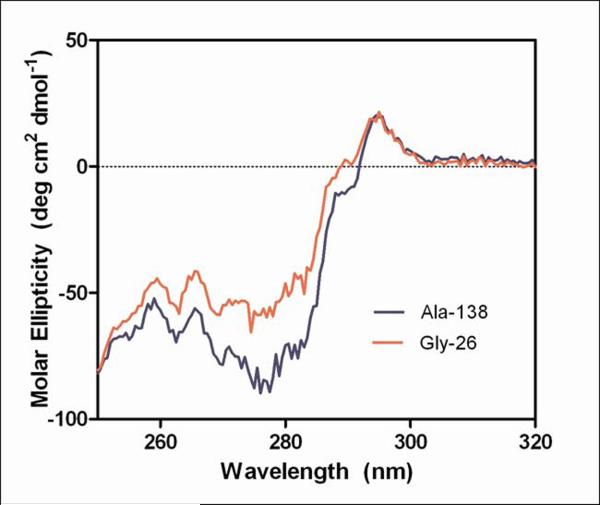
Circular dichroism measurements of purified mAb 277 Ala and Gly variants.
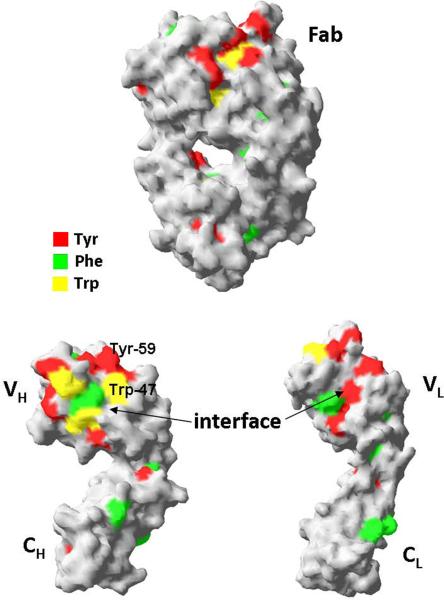
Far-UV (A) and near-UV (B) CD spectra of purified mAb from Ala-138 and Gly-26 stable cell lines. Each trace is the average of three acquisitions and has had the 20 mM phosphate buffer, pH 8 buffer signal subtracted. The Tyr, Phe, and Trp residues in the 277 Fab which contribute to the near-UV spectrum are highlighted in the crystal structure shown in (C).


