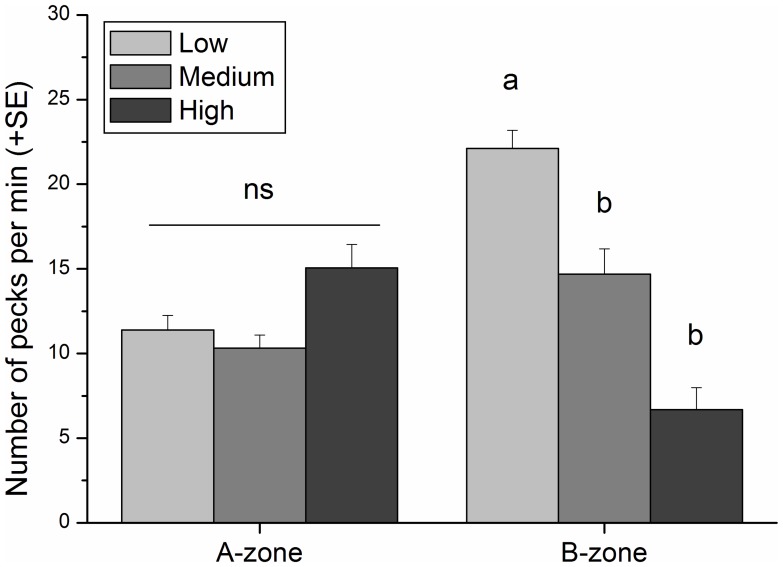
Figure 3. Pecking rate of Chromis chromis related to nautical traffic intensity.
Pecking rate (±SE) of C. chromis per minute was recorded in A- and B-zones during periods of low, medium and high traffic intensities. Different superscripts indicate significant differences within zones resulted from pairwise SNK tests (Table 2) after ANOVA (F 2, 880 = 20.64, P<0.0001). ns = not significant difference.

