
Figure 4. Adhesion gene profiles.
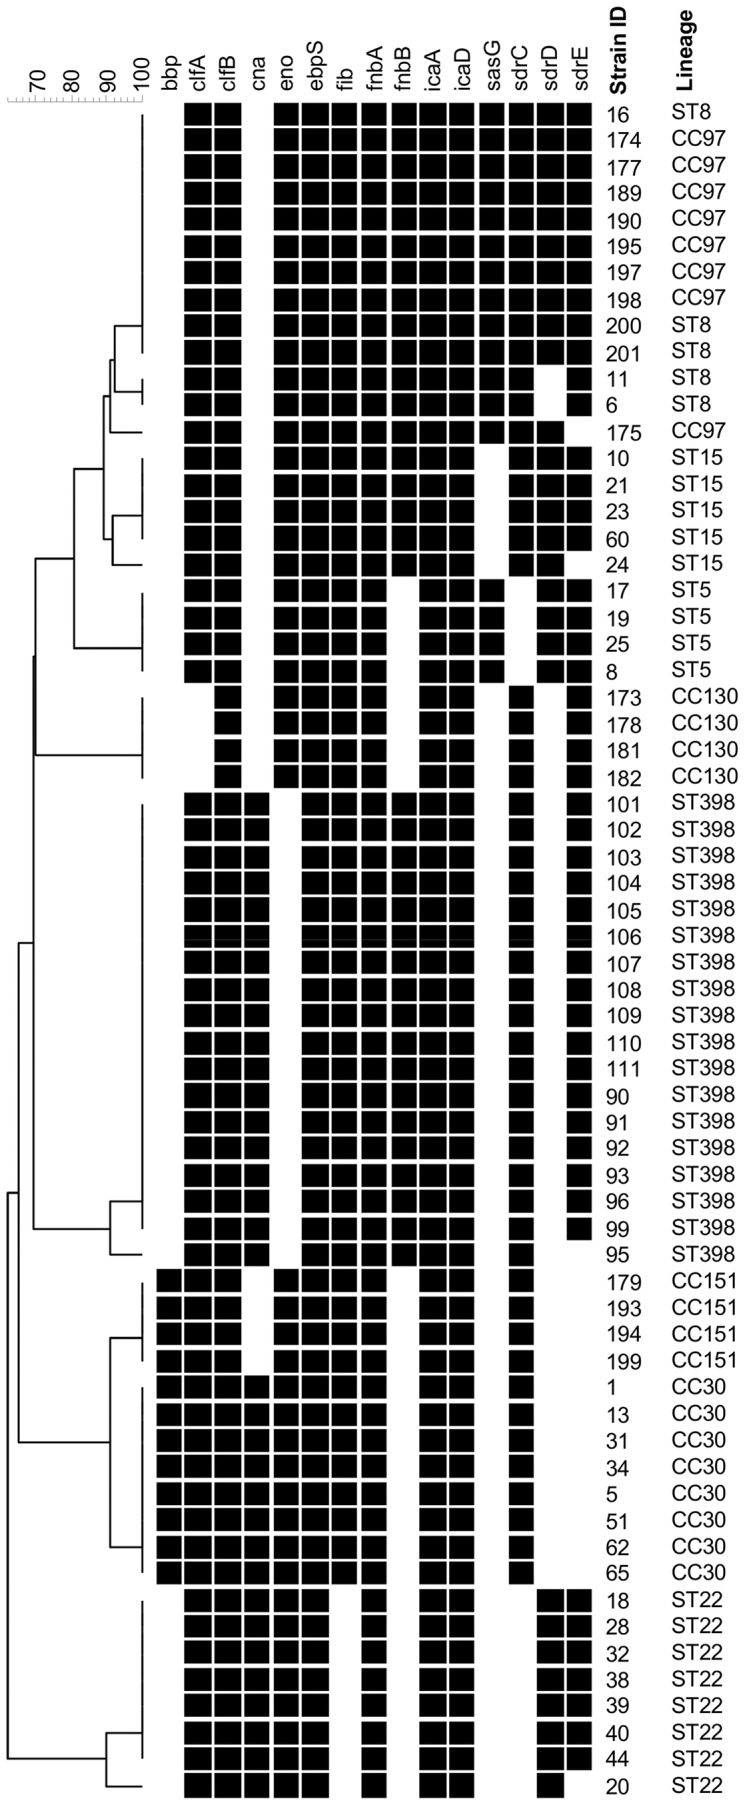
UPGMA dendrogram displaying clustering and genetic similarity (using Jaccard’s coefficient) of adhesion gene profiles of analysed strains. Black box – positive; grey – ambiguous; white/blank – negative.
Official websites use .gov
A
.gov website belongs to an official
government organization in the United States.
Secure .gov websites use HTTPS
A lock (
) or https:// means you've safely
connected to the .gov website. Share sensitive
information only on official, secure websites.
UPGMA dendrogram displaying clustering and genetic similarity (using Jaccard’s coefficient) of adhesion gene profiles of analysed strains. Black box – positive; grey – ambiguous; white/blank – negative.