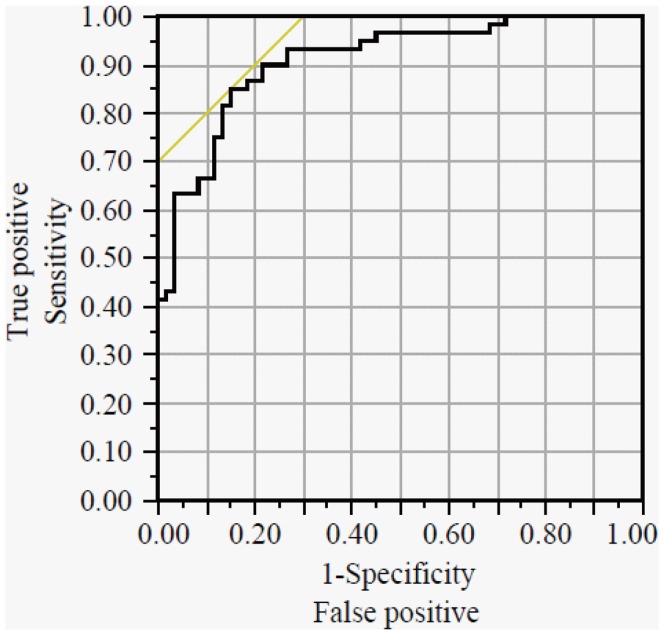
Figure 2. ROC curve of the established prediction model.
The solid curve is the ROC curve for the prediction model established on the basis of the training set. The AUC and cut-off values were 0.9097 {95% confidence interval (95% CI): 0.8438–0.9495} and 0.4945, respectively. The sensitivity, specificity, and accuracy of this model are summarized in Table 5.

