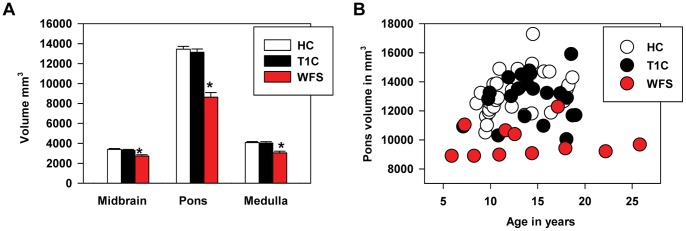
Figure 2. Volume of brainstem segments by diagnosis and age.
(A) The WFS group has reduced volumes in all three brainstem segments after adjusting for intracranial volume. A repeated measures general linear model analysis found a segmental volume by diagnosis interaction (F(4,112) = 7.6, p<.001). Volume in the WFS group was significantly different from the control groups for all three segments (*), but the effect was most striking in the pons. (B) The pons appeared to be reduced in volume in almost all WFS individuals even after adjusting for intracranial volume. This figure shows the relationship between pontine volume and age. HC = healthy controls; T1C = diabetic controls; WFS = Wolfram group.

